Synthetic Benchmarks
3DMARK
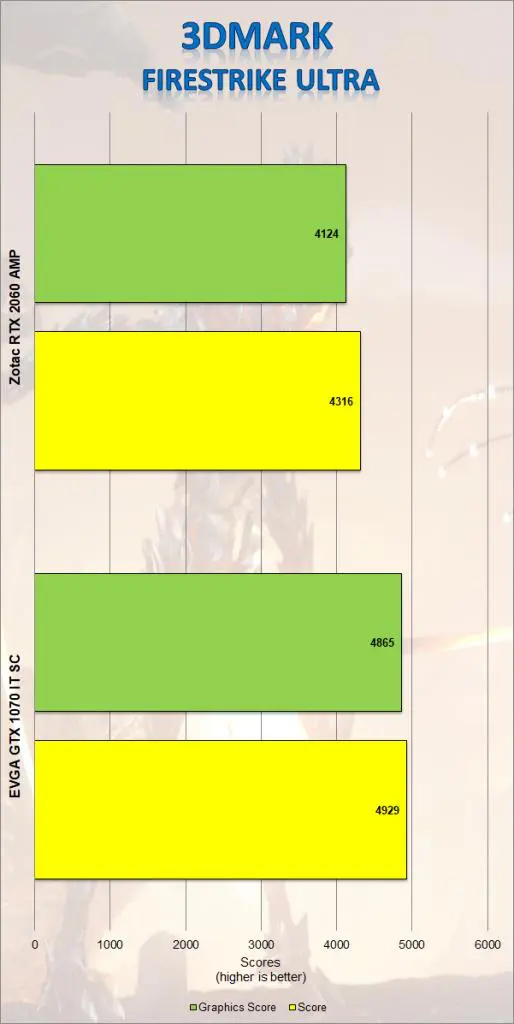
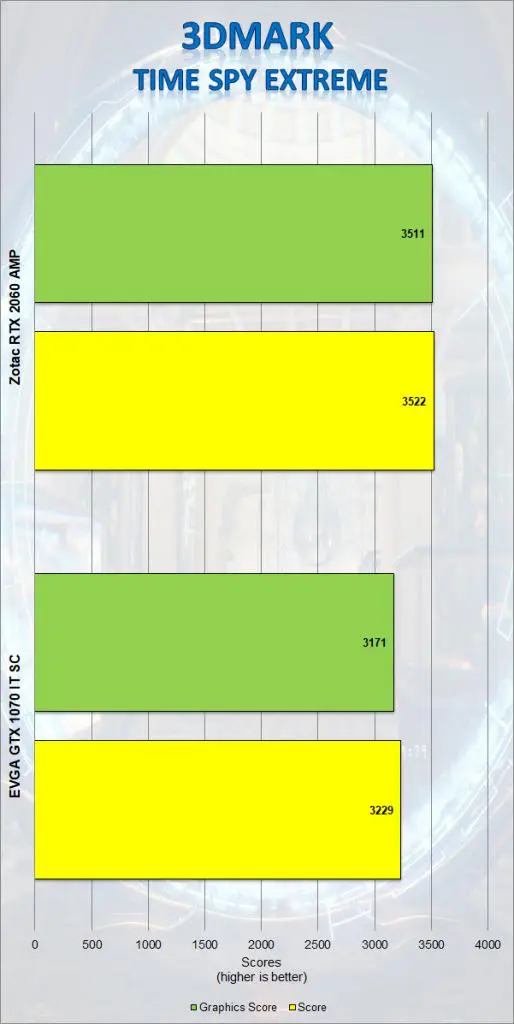
3DMARK is the go-to benchmark for all enthusiasts. It covers tests for everything from tablets and notebooks to gaming laptops and the most powerful gaming machines. For this review, we tested the Zotac RTX 2060 AMP on both the DX11 4k benchmark, Firestrike Ultra and the DX12 4k benchmark, Time Spy Extreme.
For both tests, the CPU and GPU at their stock settings. On 3DMARK Firestrike Ultra, the Zotac RTX 2060 AMP achieved an overall score 4316 and a graphics score of 4124. This was slightly lower than the overall score of 4929 and graphics score of 4865 of the 1070 TI FTW2. However, in Time Spy Extreme, the DX12 benchmark, it was a different story. The 2060 AMP achieved an overall score of 3522 and a graphics score of 3511. This beat out the overall score of 3229 and graphics score of 2171 that the 1070 TI FTW2 scored.
VR MARK
VR Mark consists of three separate tests, each more intensive on your system than the last. These tests are The Orange Room, the Cyan Room and the Blue Room. The Orange Room test is the least intense and is meant to test a system that meets the minimum hardware requirements for VR Gaming. The Cyan Room shows the user how the use of an API with less overhead can provide the user with an great VR experience, even on less than amazing hardware. The Blue Room test is designed for the latest and greatest hardware. The Blue Room renders at a whopping 5k resolution and is designed to really push your system to the limits for an amazing VR experience.
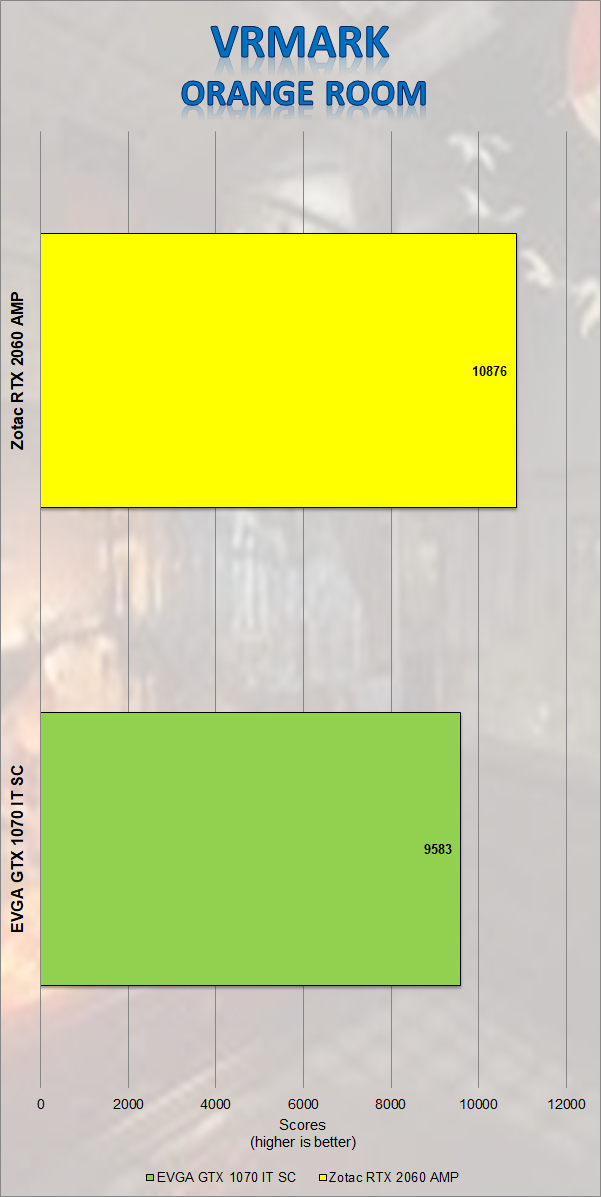
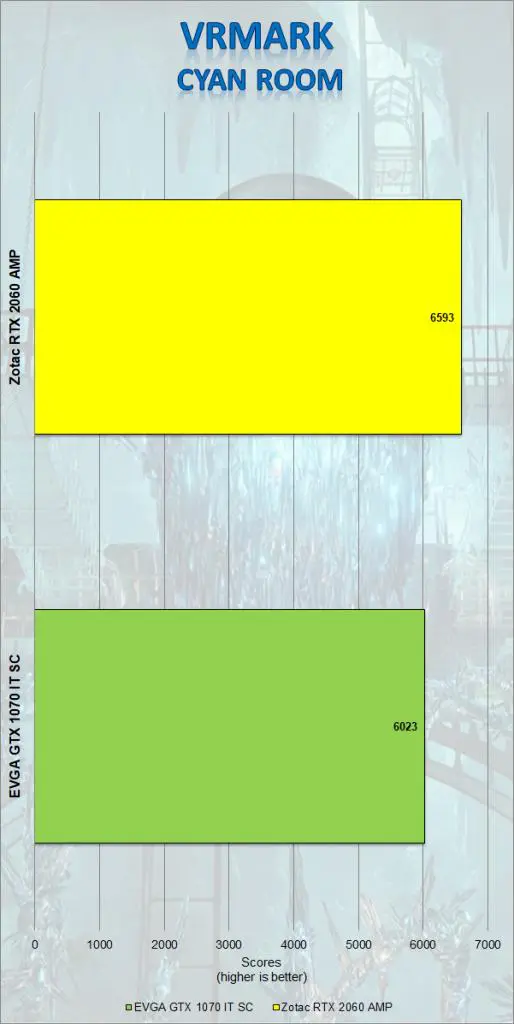
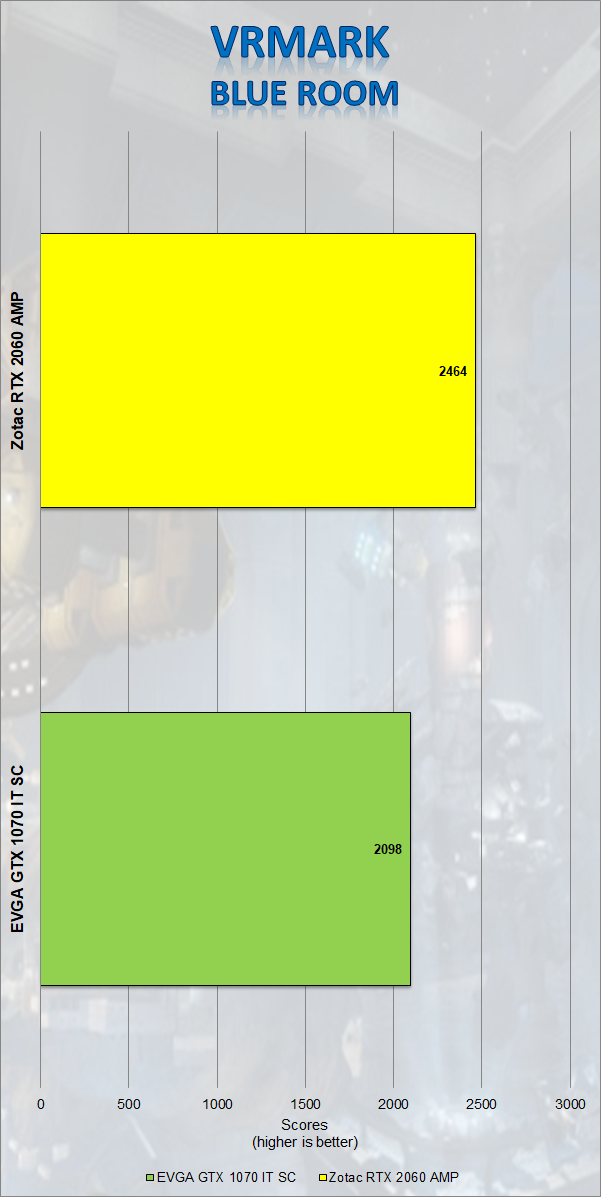
In all three tests, the Zotac RTX 2060 AMP easily out the GTX 1070 TI FTW2. In the Orange Room benchmark, the Zotac RTX 2060 AMP achieved a score of 10876. This was over 1200 points higher than the score of 9583 achieved by the GTX 1070 TI FTW2. The Cyan Room test was closer, but the Zotac RTX 2060 AMP still beat out the 1070 TI FTW2. The 1070 TI FTW2 scored 6023 compared to the 6593 of the 2060 AMP. The Blue Room was more of the same. The Zotac RTX 2060 AMP achieved a score of 2464 and the 1070 TI FTW2 scored 2098 on the Blue Room Test.
Superposition
Superposition is another GPU intensive benchmark put out by Unigine, the makers of both the very popular Valley and Heaven benchmarks. Superposition is an extreme performance and stability test for graphics cards, power supplies and cooling systems.
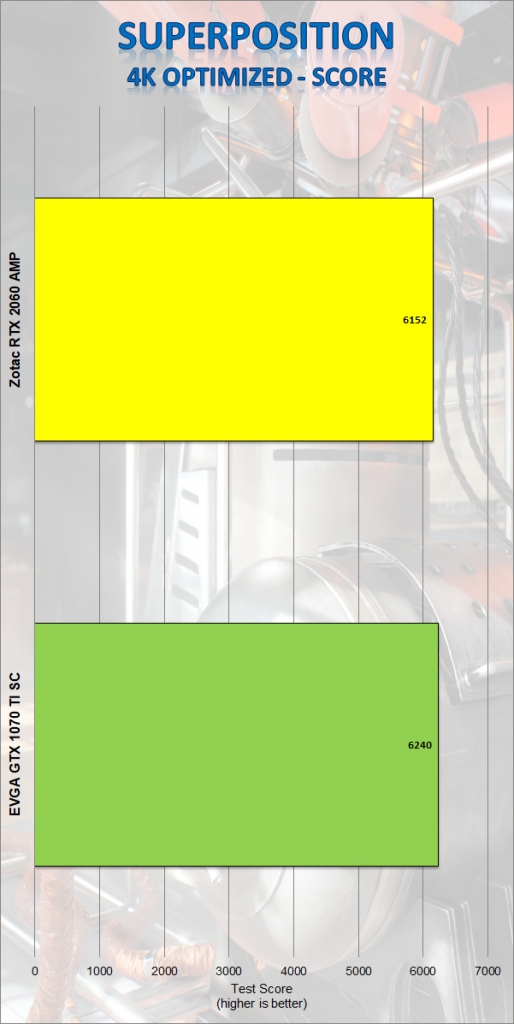
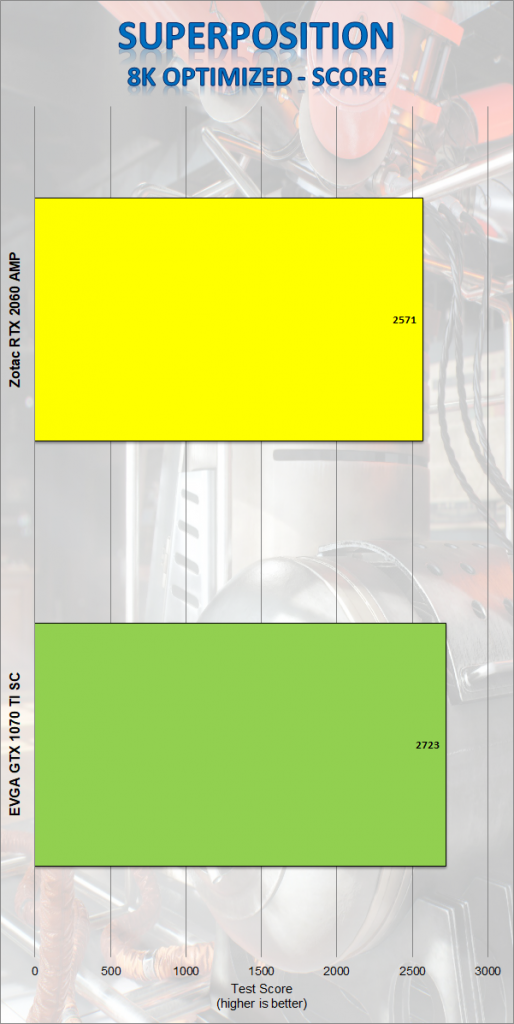
Superposition was the only synthetic benchmark where the Zotac RTX 2060 AMP fell behind the GTX 1070 TI FTW2. Although there are several different tests in Superposition, we ran the 4k optimized and the 8k optimized tests for this review. In the 4k optimized test the Zotac 2060 AMP achieved a score of 6152, just behind the 6240 of the 1070 TI FTW2. In the 8k optimized test, it was similar. The Zotac RTX 2060 AMP scored 2571 in the 8k optimized test in Superposition. This fell short of the 2723 of the 1070 TI FTW2.

Is it safe to add the extra 800