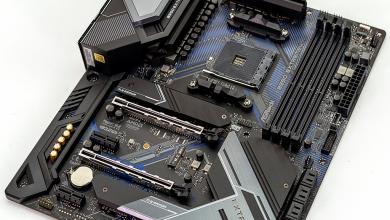
Zotac H55ITX-C-E Motherboard
Testing the Zotac H55ITX-C-E |
|
In the following tables, the result in the darker cell is the better score.
Looking at the above table, we see that the Asus showed to carry the higher averages for the most part. The Zotac H55ITX-C-E did manage to achieve the highest Marks. In the end though, there really isn’t that much difference, and it’s to see that the Zotac performed as well as it did.
In Cinebench, we see the Asus again shows to have a slight advantage.
GraySky video encoding benchmark actually makes 4 passes, but to save of space I’ve opted to show only two for the comparison. As we can see, the two rigs are fairly close to each other in performance here.
In Unigine’s Heaven Benchmark v2.0, the Asus configuration is taking a slight lead again but by a very small margin.
In the LAN Speed test the Zotac board was able to achieve the better read speed, while the Asus board took the better write speed.
Using HD Tune Pro to check the SATA performance we find the Asus in the lead for the most part. I really doubt that many users will even notice this small of a difference.
Using HD Tune Pro to check the SATA performance we find the Asus in the lead for the most part. I really doubt that many users will even notice this small of a difference.
Kicking over to USB 3.0 performance, we see the tables turn a little bit. Now we did manage to get a decent difference in burst rate, but for average file transfers we are still pretty close. The only users that are really going to see any difference in the speeds are those that transfer tons of files all the time.
In the DirectX 11 game Dirt 2, we see the Asus taking the lead again. We are only talking about a few FPS at both the 1680 x 1050 and 1920 x 1200 resolutions.
FarCry 2 is utilizing DirectX 10 and shows us nothing new. The Asus configuration is pushing out a few more FPS at both resolutions.
Even when looking at the system power consumption between the two configurations. The Zotac manages to come in at the lowest with 83W at idle, while the Asus manages to pull the lowest peak load consumption with 259.0W at peak load. The idle measurement was taken with both configurations running at idle with no extra applications running. The peak measurement was taken after completing all tests on each configuration. |
|||||||||||||||||||||||||||||||||||||||||||||||||||||||||||||||||||||||||||||||||||||||||||||||||||||||||||||||||||||||||||||||||||||||||||||||||||||||||||||||||||||||||||||||||||||||||||||||||||||||||||||||||||||||||||||||||||||||
