XPG SPECTRIX D40 RGB DDR4 3000MHz Memory Review
Software, Test System, Benchmarks, and Overclocking
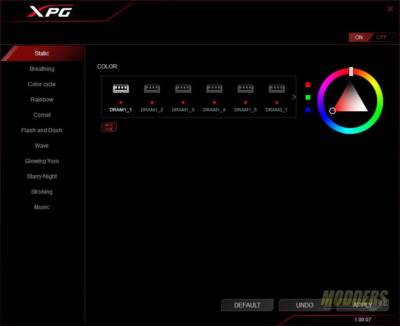
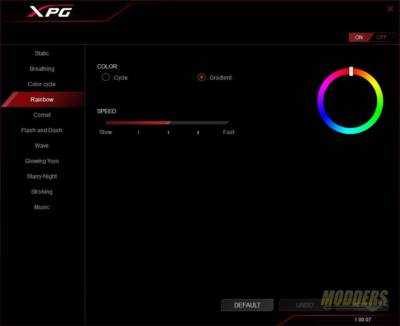
If you don’t happen to have an Asus motherboard, do not fret. ADATA provides a utility that allows you to customize the lighting on the XPG SPECTRIX D40. The application is small at 30MB and can be downloaded from here. Once installed, open the application and you can begin to customize the lighting profiles.
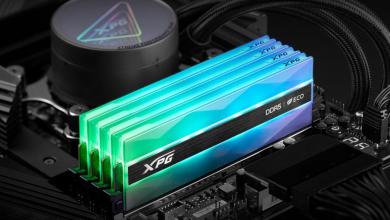
The first option allows you to set a static color for each of the memory modules. Each module has 5 LEDs. Each of the LEDs can be set as a different color using the color wheel on the right side of the application.
Breathing mode brightens and dims the LEDs according to a time pattern (longer/shorter)which you set in the option. The color cycle option has no user selectable options.
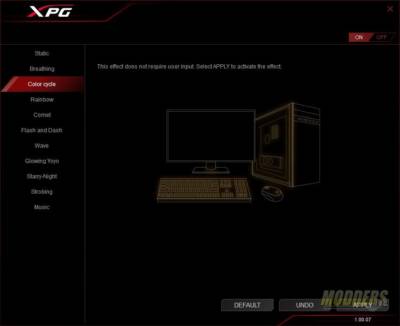
The rest of the options below, allow you to either set a single color, cycle colors or set a gradient. With the gradient setting, the color wheel has two sliders so you can limit which colors will be cycled to.
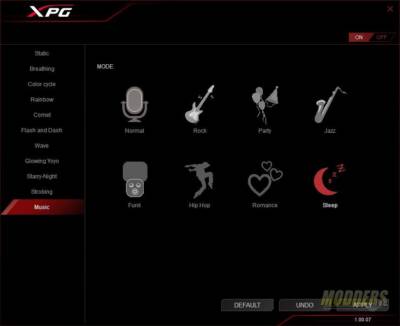
Music mode uses your XPG SPECTRIX D40 LEDs to give you a graphic representation of the music or any audio source playing on your PC. Each option has a different lighting profile and sensitivity settings.
Test System
- Core I7 7700k
- Gigabyte Z270X Gaming 7
- Aorus Radeon RX580 XTR 8G
- 16 GB XPG SPECTRIX D40 DDR4 3000MHz.
- Deep Cool Captain 240
- Deep Cool Genome II
- Corsair RM850 80+Gold PSU
- HyperX Predator
Benchmarks
- AIDA64 Engineer
- Passmark Performance Test 9.0
- ROG Realbench
- SiSoft Sandra Lite
- 7-Zip
- 3DMARK Time Spy
Utilities
CPU-Z
Our testing methods are always the same, no matter what the review. The room is kept as close to 20°c as possible. The 7700k used in this review was left at stock Intel speeds. The BIOS for the motherboard was updated if needed. Most benchmarks were run three times and averaged to get the result.
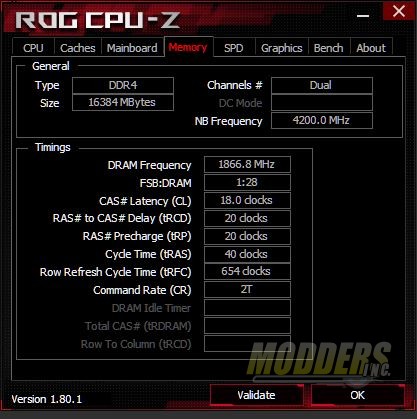
For overclocking, I wanted to limit factors outside the memory kit for performance gains. I left the CPU and GPU at their stock factory shipped configurations.I was able to reach 3733 MHz at 18-20-20 timings with a voltage of 1.38. I ran the AIDA64 torture test for about 4 hours after overclocking to test stability. After 4 hours, the PC was up and running just fine.
AIDA64 ENGINEER
AIDA64 implements a set of 64-bit benchmarks to measure how fast the computer performs various data processing tasks and mathematical calculations. Multi-threaded memory and cache benchmarks are available to analyze system RAM bandwidth and latency. Benchmark pages of AIDA64 Extreme provide several methods to measure system performance. These benchmarks are synthetic, so their results show only the theoretical maximum performance of the system. The AIDA64 suite has various benchmarks for CPU, FPU, GPU, storage and memory testing.
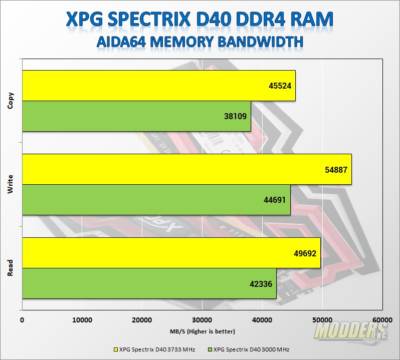
The XPG SPECTRIX D40 scores over 40,000 MB/s in stock trim. Kick the frequency up a bit and it jumps up closer to 50K MB/s. Latency with XMP enabled and set to profile 1 was reported at 46.0 ns.
7-Zip
The 7-zip benchmark shows a rating of MIPS (million instructions per second). The rating value is calculated from the measured speed, and it is normalized with results of Intel Core 2 CPU with multi-threading option switched off. So, if you have modern CPU from Intel or AMD, rating values in single-thread mode must be close to real CPU frequency. There are two tests, compression with LZMA method and decompression with LZMA method. Once the total passes reach 100, the score is taken.
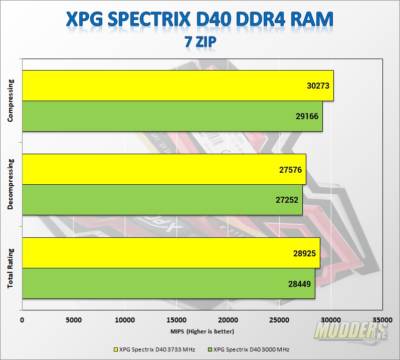
The compression test resulted in 29,156 MIPS (million instructions per second) in stock form and 30,273 MIPS overclocked. Decompressing was a little closer at 27,252 MIPS and 27576 respectively. Overclocking the ram pushes it ever closer to the 30K MIPS mark at 28,925.
SiSoft Sandra Lite
Sandra Lite is a free version of SiSoft’s Sandra testing suite. Sandra Lite is a synthetic benchmark program that has its own set of system memory specific benchmarks. Aggregated scores of the Memory bandwidth performance in Gigabytes per second and Memory Transaction Throughput in total throughput per second are measured (higher is better).
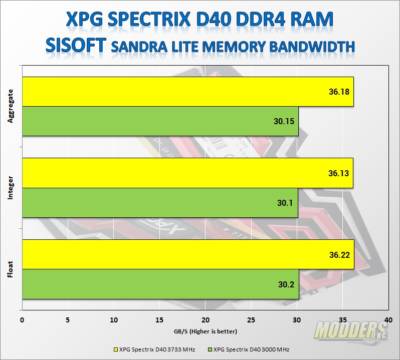
In both cases, there’s not much difference between the three individual tests. However, the extra 733 MHz yields an extra 6 GB/s in this test. In all the Sisoft Sandra test we ranked above the 95% at stock speeds and 97-98% overclocked, except, for cache, the results were in the 87% rank stock and 89% overclocked.
ASUS ROG Realbench
ROG Realbench is an open source program, designed to test your PC as it would run in real-world scenarios. It’s a semi-synthetic testing suite that collects four different programs and can perform controlled runs of each related to image editing (GIMP), video encoding (Handbrake H.264), OpenCL (Luxmark) and Heavy Multitasking (Combination of all three at the same time).
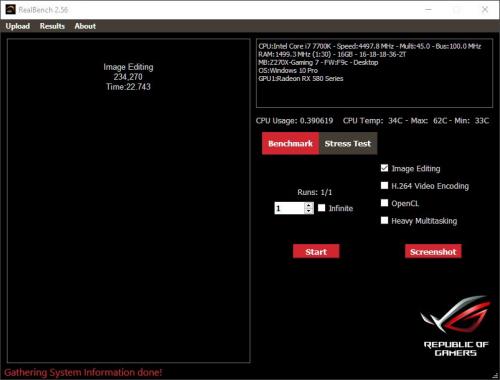
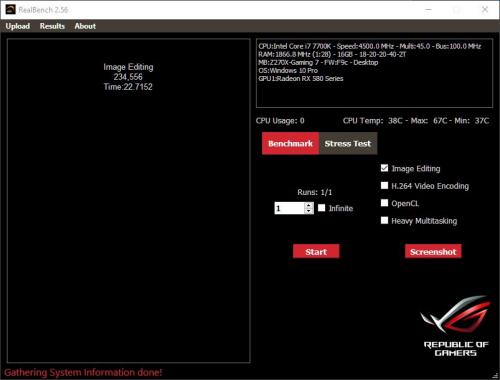
In the ROG Realbench, results are not that much better and fall within the tolerance. A good score none the less; overclocking didn’t help improve much here.
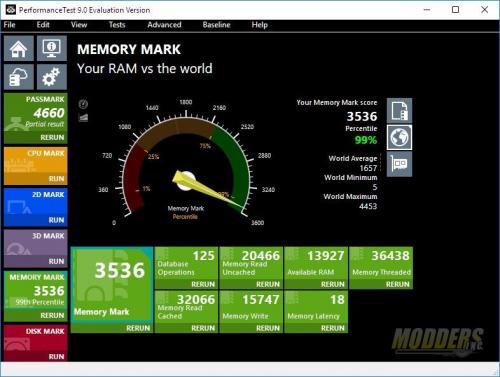
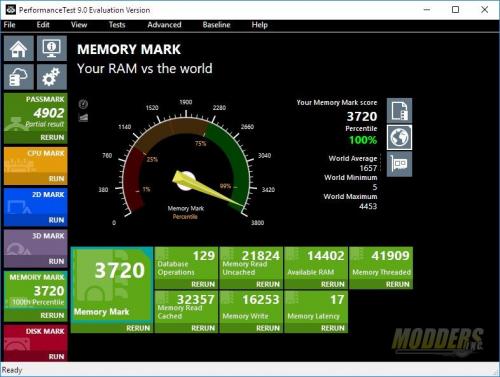
Passmark Performance Test – Memory Mark – Threaded
“Fast, easy to use, PC speed testing and benchmarking. PassMark PerformanceTest ™ allows you to objectively benchmark a PC using a variety of different speed tests and compare the results to other computers.” Performance Test 9.0 is an overall benchmark that tests every area of your PC. For this review, we didn’t do the entire Performance Test.
3DMARK Time Spy
3DMark is a computer benchmarking tool created and developed by Futuremark used to determine the performance of a computer’s 3D graphics rendering and CPU workload processing capabilities. It does this through a series of graphics and physics and or CPU tests.
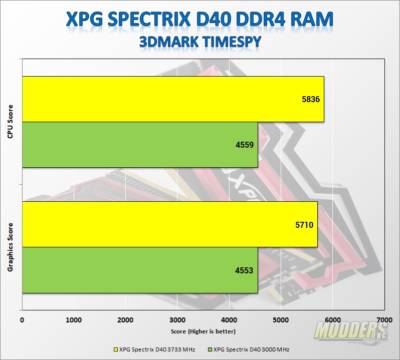 Overclocking the XPG SPECTRIX D40 did show a slight performance increase over the stock settings.

Not a good idea to call something spectrix after the Spectre problems. Not a great name at all.