Sapphire Pure 785G Motherboard
Observations |
|
In this observations section I wanted to address two things. Performance of the On board graphics and the overall performance of the board itself. First thing I am going to do is look at the integrated 4200 Chip and see how well it compares to a Sapphire 4850. This is the closest I had to to match it in the HD 4XXX series. I also thought that there are so many benchmarks available for this popular card that it would be easy for readers to reference.
Before I get too far into benchmarks I’d first like to give my overall impression of the Integrated HD4200 graphics from a general use stand point. I used the card for several days going about my usual routine of loading programs, web surfing and watching a few movies just to get an overall idea of an everyday performance of the Integrated graphics. I’ve had some issues in the past with stuttering and freezing and wanted to make sure that this wasn’t going to happen for those who intent to specifically use the HD4200 as their main graphics solution. Say as in a daily use computer or even media PC. I’m happy to say that I had no issues what so ever. Playing movies and watching online streaming video, opening up files everything you can do graphically aside from gaming this card performed solidly. I used the card on an LCD screen up to 1080p and had absolutely no issues. Now moving on to benchmarks on the card. Let me just say that my original Idea was to play several games with the integrated graphics and compare them to the HD 4850. I soon discovered that although the Integrated Graphics on this board are impressive they still are not even close to being good enough to run a decent game. I got a little bit into trying Left4Dead2 at low settings and decided I was wasting time with graphs when I can just tell you it won’t work for that. I’m really disappointed too as I was really hopeful that there would be a possibility of at least some casual low impact gaming but no. Was not meant to be.
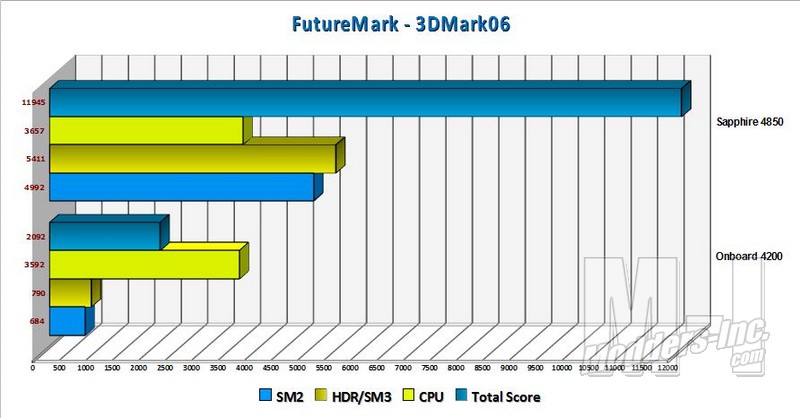
So To give a graphical representation of the fact that this card is NOT meant for any kind of serious or causal gaming let me show you the dismal Futuremark scores in 3dMark 06. As you can see from the graph above (click to enlarge) the 4200 isn’t even in the same league as the 4850. I imagine if you bought a PCI-express version of this card it would even do much better. There is just no contest. I imagined the HD 4200 to get maybe half the score of the HD4850 but not a total score of 2092, and yes I ran it several times to check the numbers.
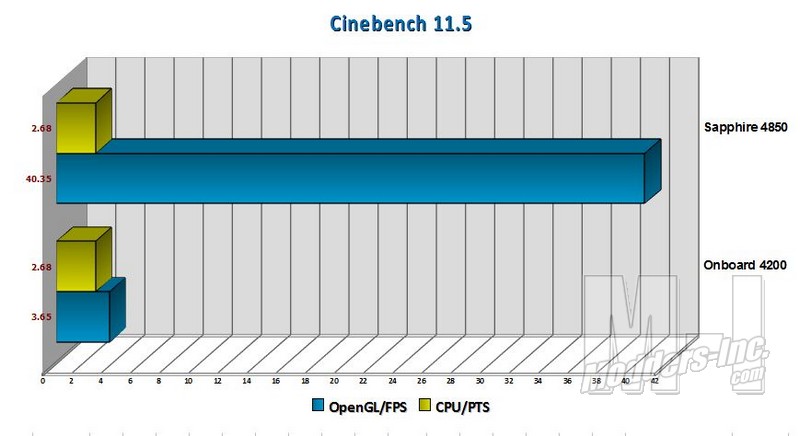
Deciding that maybe gaming wasn’t the cards strength I moved to Cinebench. “CINEBENCH is a real-world cross platform test suite that evaluates your computer’s performance capabilities. CINEBENCH is based on MAXON’s award-winning animation software CINEMA 4D.” The Cinebench benchmark evaluates both the graphic card performance and the users CPU at the same time. As you can see from looking at the chart above the Integrated Graphics lagged behind. As before I guessed the HD4200 would be behind in the numbers just not this far behind. It’s pretty obvious at this point that the on board solution just isn’t powerful enough for any serous graphic work or gaming. On the bright side this shouldn’t be a surprise to anyone. Most On board graphics are not up to par with most consumers high end graphics needs, but really they are not meant to be either.
So now I want to look at the Boards overall Performance and Overclocking abilities. I mentioned earlier in the bios section that the overclocking abilities of the card although limited are adequate to get a slight boost in performance. In the graphs below I am going to show what the board can do at stock speeds verses being overclocked and compare the % of performance increase. This should give you an overall look at the potential this board will give you and whether it will meet your needs if you are a hard core performance enthusiast.
Stock Settings: Overclocked Settings:
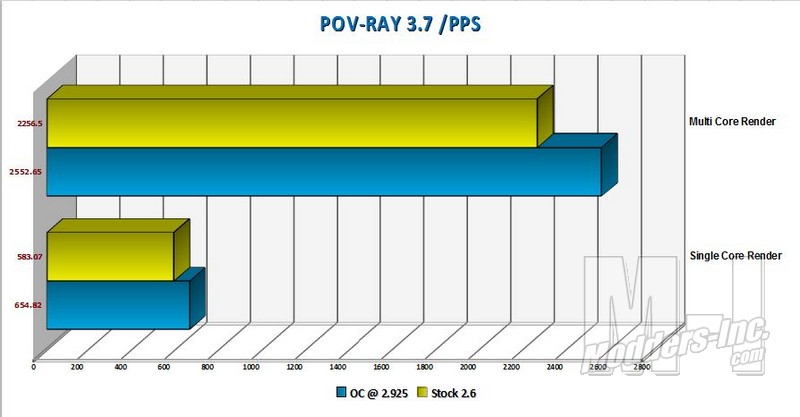 (click to enlarge) “The Persistence of Vision Raytracer is a high-quality, totally free tool for creating stunning three-dimensional graphics” also included is a handy dandy benchmark. POV-RAY is another one of those good benches that can evaluate your systems overall number crunching abilities and let you compare/contrast to changes and tweaks in your settings. In the above graph and specifications you can see that with the limitations of the motherboard I was only able to take the AM3 620 to 2.92. This isn’t terrible but it isn’t really that impressive either and only nets me 12.69% overclock. Comparing that to the results in
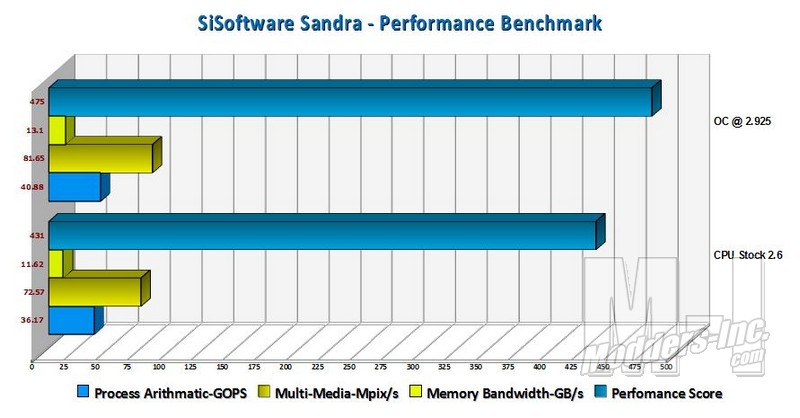
Looking at the difference in performance between the stock and overclock settings in SANDRA we see a good overall performance increase score. Although it’s only a little over a 10% increase in performance that’s still pretty decent for a synthetic benchmark. Notice the numbers go up respectively on the Memory bandwidth with the overclocking as well.
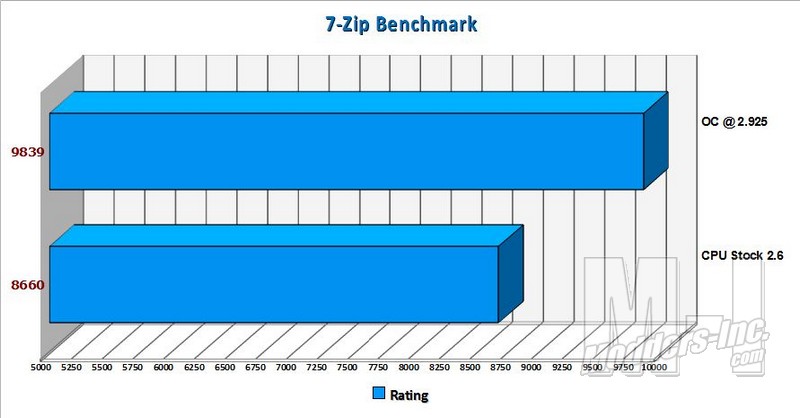
Here I ran the integrated benchmark that comes with 7-zip. It’s a decent synthetic benchmark for stress testing Memory usage and overall CPU stability. This benchmark uses file compression to stress the system and measures the results in MIPS (Million Instructions Per Second). The performance increase here is a little over 13.5% and is a nice result for our overclock.
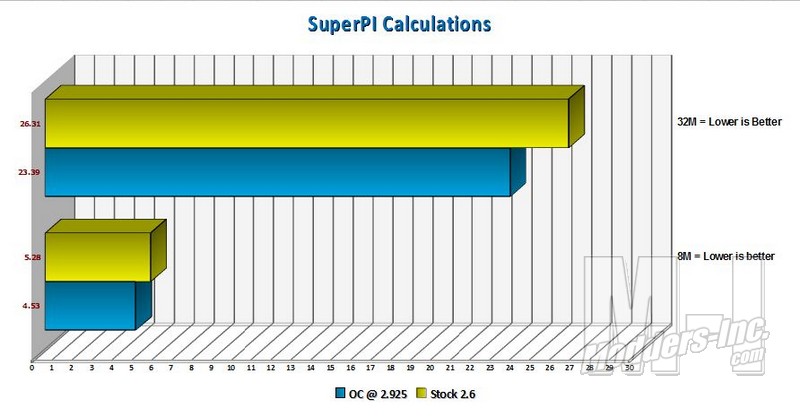
Lastly I did some SuperPi Calculations using the stock 8M and 32M benchmark settings for both the stock and overclocked Processor. The 32M overclock comes in with an increase of slightly over 13% while the 8M give an impression that there is a 15% increase in performance. Both of these results are in line with our Modest overclock of the processor. As you can see across the board the results are indicative of the overall system performance increase of our modest overclock. It would have been nice to get a larger gap in performance but again we are limited in voltage for what the board will provide for the processor. Perhaps a bios revision down the line will allow for voltages above 1.4 and push us up to the coveted 3.0Ghz OC.
|
