QNAP TS-451 Network Attached Storage Review
Testing
| System Configuration | |||
| Case | Cooler Master Cosmos II SE | ||
| CPU | Intel i7 4770K | ||
| Motherboard | MSI Z97m Gaming | ||
| Ram | 2 GB G.Skill F3-12800CL9q DDR3-1600 | ||
| GPU | MSI GTX 970 OC | ||
| Hard Drives | Samsung 840 EVO 256gb SSD | ||
| Western Digital black 500 gb 7200 RPM HDD | |||
| Power Supply | NXZT Hale v2 1000 Watt power supply | ||
Four Seagate 4 TB 7200 RPM desktop drives were installed and used in the NAS tests.
A dual port Intel network card was installed in the system.
In our testing I used the Thecus N5550 to get comparison numbers against the TS-451. Both NAS devices use 4 GB of ram and the same Seagate NAS hard drives. The major difference between the two is the processor. The Thecus N5550 used the Intel Atom D2550 1.86 GHz dual core CPU whereas the QNAP TS-451 uses the Intel Celeron 2.41GHz (2.58 GHz Turbo).
Network Layout
For all tests the NAS was configured to use the a single network interface. One CAT 6 cable was connected to the Cisco 2960 from the NAS and one CAT 6 cable was connected to the workstation from the switch. Testing was done on the workstation with only 1 network card active. The switch was cleared of any configuration and left in a unconfigured state.
Software
To test NAS Performance we use four applications; The Intel NAS Performance toolkit, Crystal Disk Mark, Atto Storage benchmark, and Anvil Storage utilities.
The Intel NAS Performance toolkit simulates various tasks for storage
devices such as video streaming, copying files and folders to and from the NAS as well as creating content directly on the NAS. To limit caching, a 2GB G.Skill memory module was used in all tests. All options in the Performance toolkit were left that the defaults. The NAS performance test is free to download. You can pick up a copy for yourself here.
To run Crystal Disk Mark, Atto, and Anvil storage utilities, a network share was mapped as a drive letter.
All tests were run a total of three times then averaged to get the final result.
RAID 0, RAID 10, and RAID 5 are all tested.
Tests for RAID 5 were run after the array was fully synchronized
RAID Information
 |
 |
 |
 |
 |
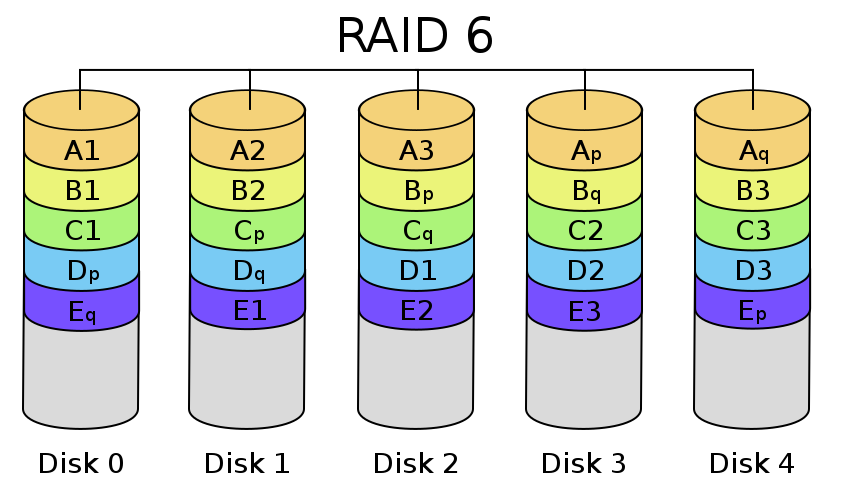 |
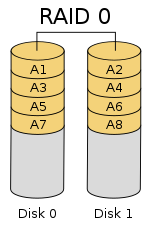
| Images courtesy of Wikipedia | ||
JOBD or Just a Bunch Of Disks is exactly what the name describes. The hard drives have no actual raid functionality and are spanned at random data is written at random.
RAID 0 is a stripe set and data is written across the disks evenly. The advantage of RAID 0 is speed and increased capacity. With RAID 0 there is no redundancy anddata loss
is very possible.
RAID 1 is a mirrored set and data is mirrored from one drive to another. The advantage of RAID 1 is data redundancy as each piece of data is written to both disks. The disadvantage of RAID 1 is write speed is decreased as compared to RAID 0 due to the write operation is performed on both disks. RAID 1 capacity is that of the smallest disk.
RAID 10 combines the 1st two raid levels and is a mirror of a stripe set. This allows for better speed of a RAID 0 array but the data integrity of a RAID 1 array.
RAID 5 is a stripe set with parity. RAID 5 requires at least 3 disks. Data is striped across each disk, and each disk has a parity block. RAID 5 allows the loss of one drive without losing data. The advantage to RAID 5 is read speeds increase as the number of drives increase but the disadvantage is write speeds are slower as the number of drives is increased. There is overhead with RAID 5 as the parity bit needs to be calculated and with software RAID 5 there is more of a performance hit.
RAID 6 expands on RAID 5 by adding an additional parity block to the array that is distributed across all the disks. Since there are two parity blocks in the array more overhead is used with a RAID 6 array.
For a full breakdown of RAID levels, take a look at the Wikipedia article here.
