Benchmarking and Overclocking
AIDA64 ENGINEER
AIDA64 implements a set of 64-bit benchmarks to measure how fast the computer performs various data processing tasks and mathematical calculations. Multi-threaded memory and cache benchmarks are available to analyze system RAM bandwidth and latency. Benchmark pages of AIDA64 Extreme provide several methods to measure system performance. These benchmarks are synthetic, so their results show only the theoretical maximum performance of the system. The AIDA64 suite has various benchmarks for CPU, FPU, GPU, storage and memory testing.
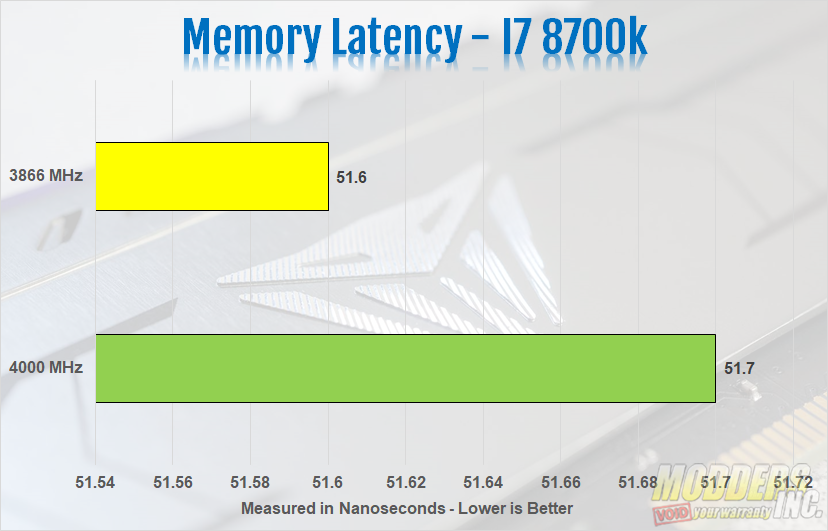
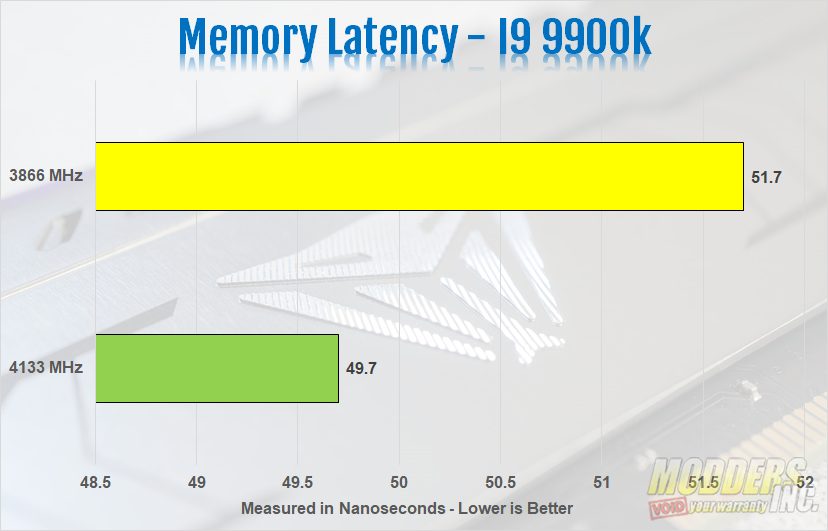
The first part of the AIDA64 memory test is the latency test. The latency is measured in nanoseconds. Running the I7 8700k with X.M.P profile #1 enabled, and the memory running at 3866 MHz, the latency was 51.6 nanoseconds. With the Viper Steel running at 4000 MHz, the latency was 51.7. Not much of a difference. Running the 9900k with the X.M.P profile #1 enabled, and the memory running at 3866 MHz, the latency was 51.7 nanoseconds. With the Viper Steel running at 4133 MHz, the latency was 49.7. The results for both the I7 8700k and the I9 9900k were almost identical.
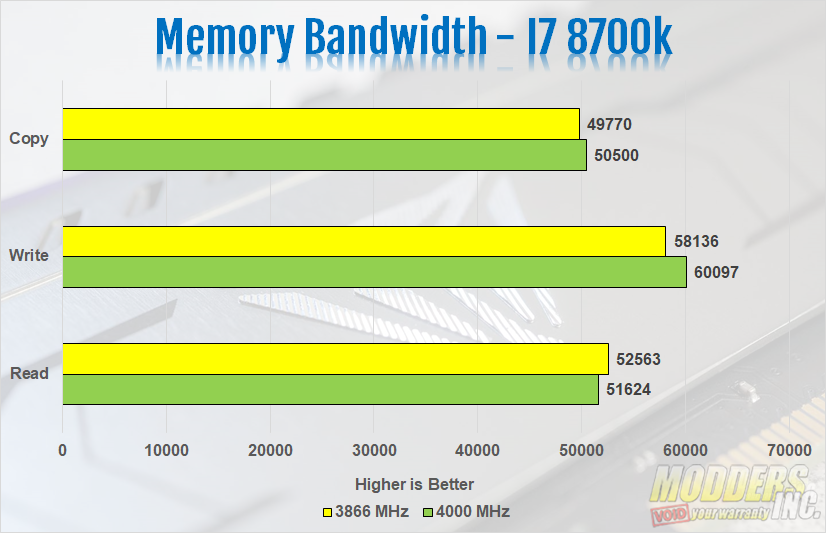
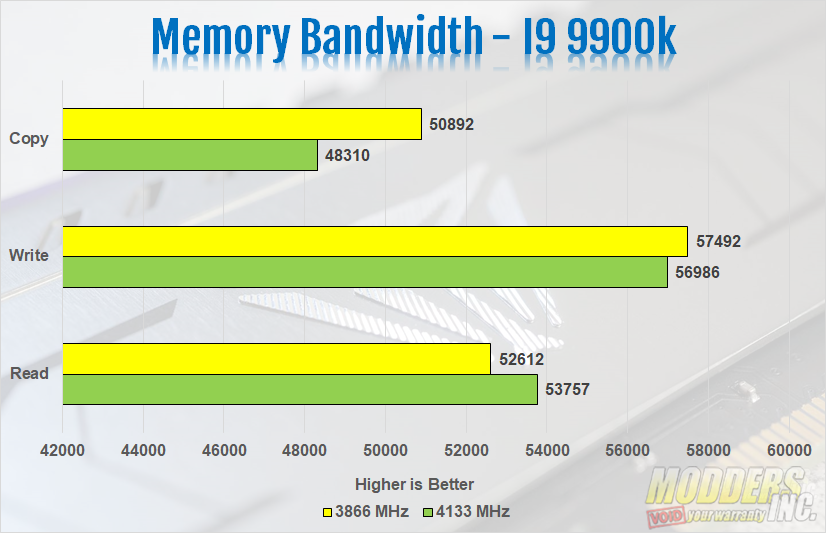
On the I7 8700k on the memory bandwidth test, the Viper Steel Series scored 52563 on the read, 58136 on the write and 49770 on the copy. This was with the Viper Steel running at 3866 MHz. With the memory running at 4000 MHz, the Viper Steel scored 51624 on the read, 60097 on the write and 50500 on the copy. Next we ran the Viper Steel with the 9900k. With the memory running at 3866, the Viper Steel scored 52612 on the read, 57492 on the write and 50892 on the copy. With the memory running at 4133 MHz, the Viper Steel scored 53757 on the read, 56986 on the write and 48310 on the copy on the Adia64 Memory Bandwidth test.
7-Zip
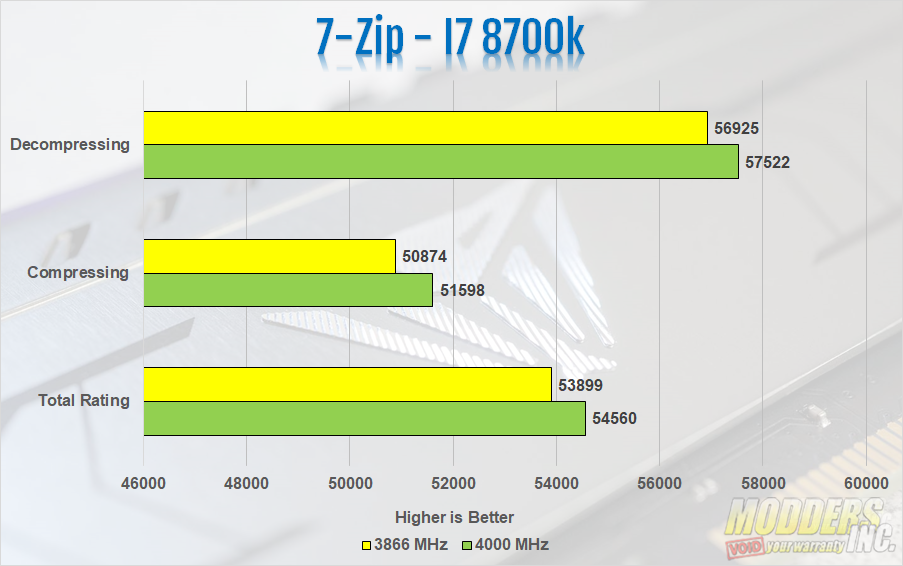
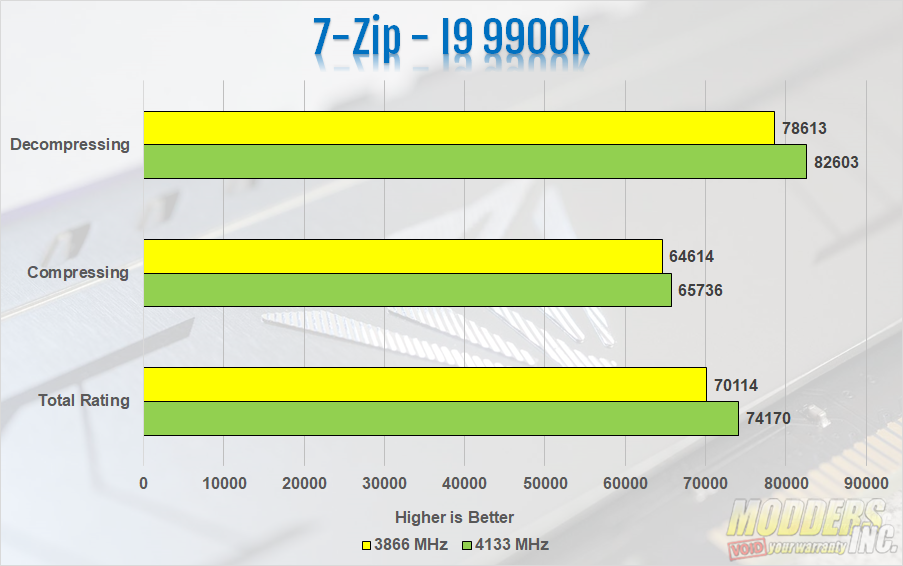
The 7-zip benchmark shows a rating in MIPS (million instructions per second). The rating value is calculated from the measured speed, and it is normalized with results of Intel Core 2 CPU with multi-threading option switched off. So, if you have modern CPU from Intel or AMD, rating values in single-thread mode must be close to real CPU frequency. There are two tests, compression with LZMA method and decompression with LZMA method. Once the total passes reach 100, the score is taken. First are the I7 8700k results. At stock, the decompression test resulted in a rating of 56925 MIPS. The compression test resulted in a rating of 50874 MIPS. The total rating was 53899 MIPS (million instructions per second) after 100 passes. 100 passes took about 19 minutes. With our memory running at 4000 MHz, the decompression test resulted in a rating of 57522 MIPS. The compression test resulted in a rating of 51598 MIPS. The total rating was 54560 MIPS
Next are the I9 9900k results. At stock, the decompression test resulted in a rating of 78613 MIPS. The compression test resulted in a rating of 64614 MIPS. The total rating was 70114 MIPS. Again, the benchmark ran for a total of 100 passes/ With our memory running at 4133 MHz, the decompression test resulted in a rating of 82306 MIPS. The compression test resulted in a rating of 65736 MIPS. The total rating was 74170 MIPS. I was impressed with the results with the memory running at 4133.
ASUS ROG Realbench
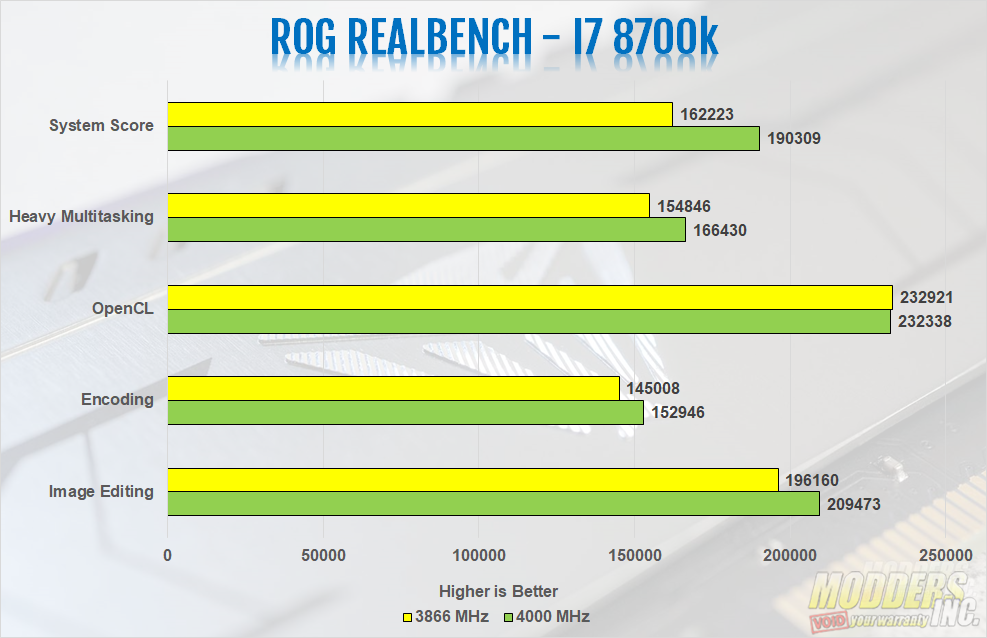
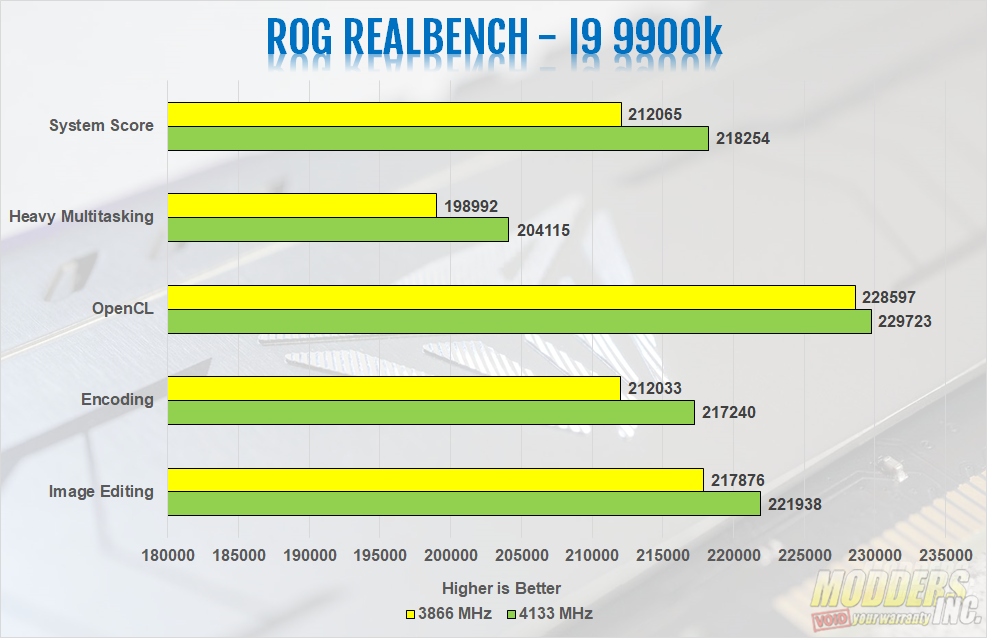
ROG Realbench is an open source program, designed to test your PC as it would run in real world scenarios. It’s a semi-synthetic testing suite that collects four different programs and can perform controlled runs of each related to image editing (GIMP), video encoding (Handbrake H.264), OpenCL (Luxmark) and Heavy Multitasking (Combination of all three at the same time). ROG Realbench also focuses on single threaded CPU and memory performance that is frequency and timing sensitive.For this review, we ran the entire suite in ROG Realbench. This included the Image Editing, Encoding, OpenCL, Heavy Multitasking and an overall System Score. For the most part, the I9 9900k scored better on almost all parts of the Realbench benchmark with one exception. That exception was the OpenCL test in which the I7 8700k results were slightly higher than the results on the 9900k.
Si Soft Sandra LITE
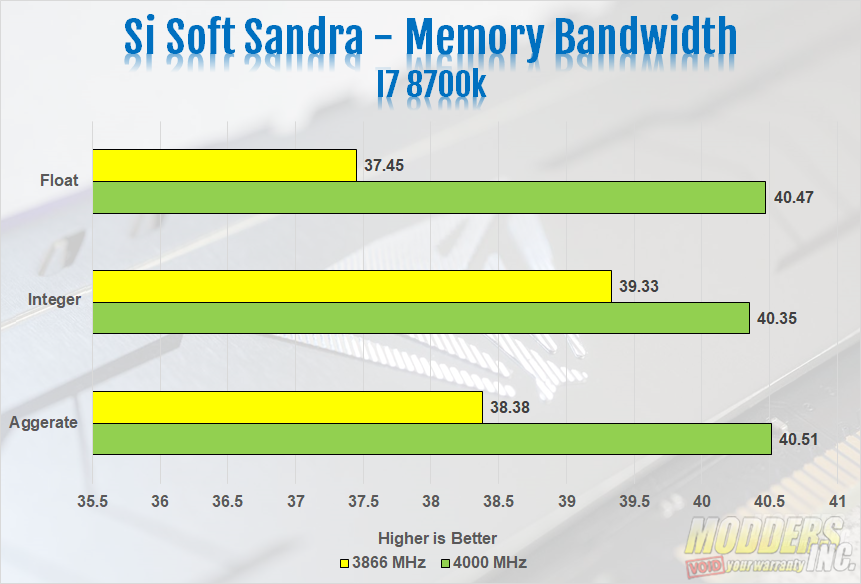
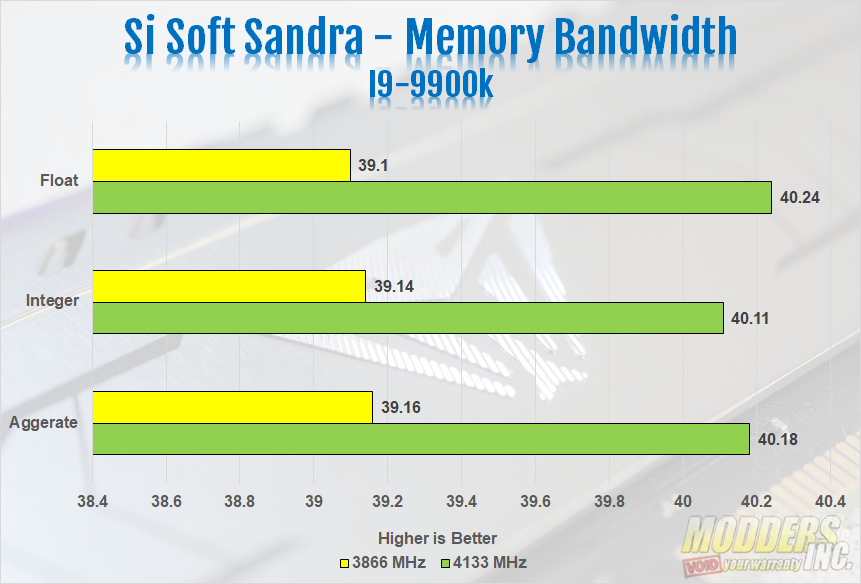
Sandra LITE is a free version of Si Soft’s Sandra testing suite. Sandra Lite is a synthetic benchmark program that has its own set of system memory specific benchmarks. Aggregated scores of the Memory bandwidth performance in Gigabytes per second and Memory Transnational Throughput in total throughput per second are measured (higher is better). Memory latency is also measured in nano-second (lower is better). The links below each picture or chart will show the ranked results.For Si Soft Sandra Lite, we compared the memory bandwidth with our test system running the i7 8700k and the i9 9900k.
Passmark Performance Test – Memory Mark – Threaded
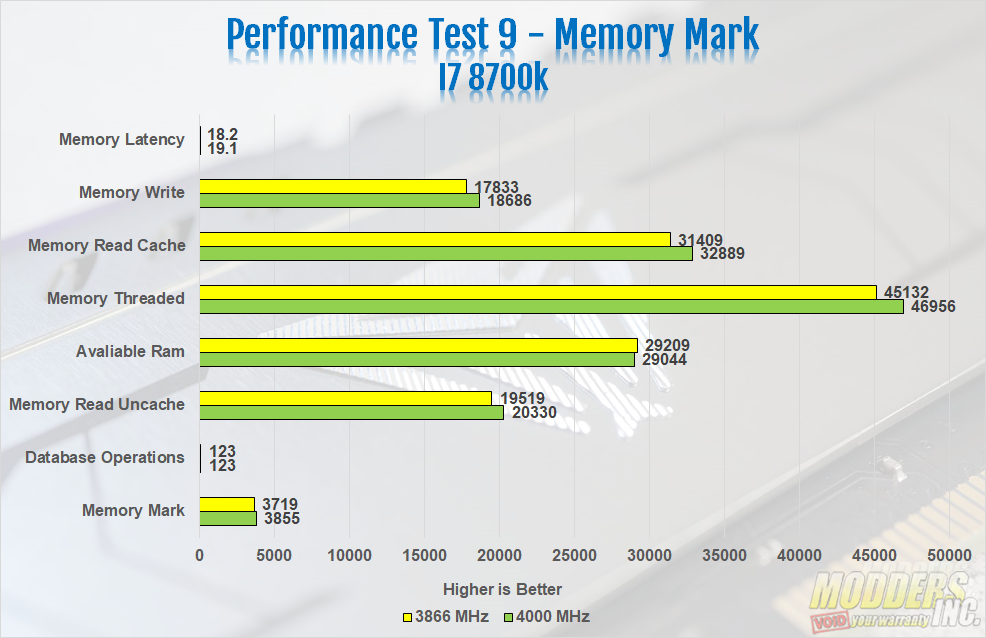
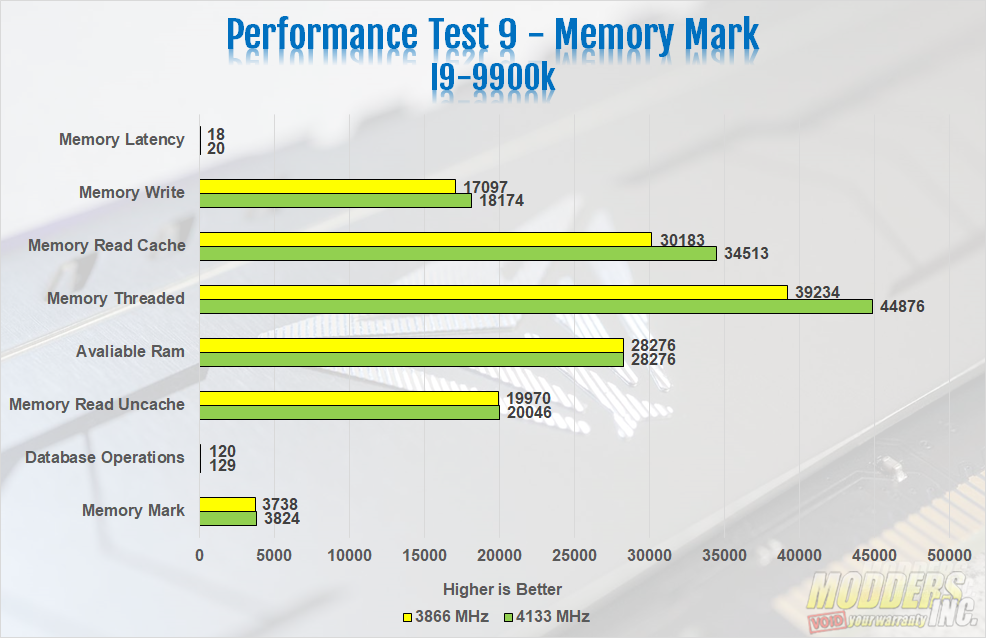
“Fast, easy to use, PC speed testing and benchmarking. PassMark PerformanceTest ™ allows you to objectively benchmark a PC using a variety of different speed tests and compare the results to other computers.” On the Performance Test 9 Memory Mark test, our Viper Steel performed just about the same on both the I7 8700k and the I9 9900k. At stock, the over all score went to the 9900k with a Memory Mark score of 3738 to the Memory Mark score of 3719 on the 8700k. With the memory over clocked, the Memroy Mark score was 3855 on the 8700k and 3824 on the 9900k.
Overclocking
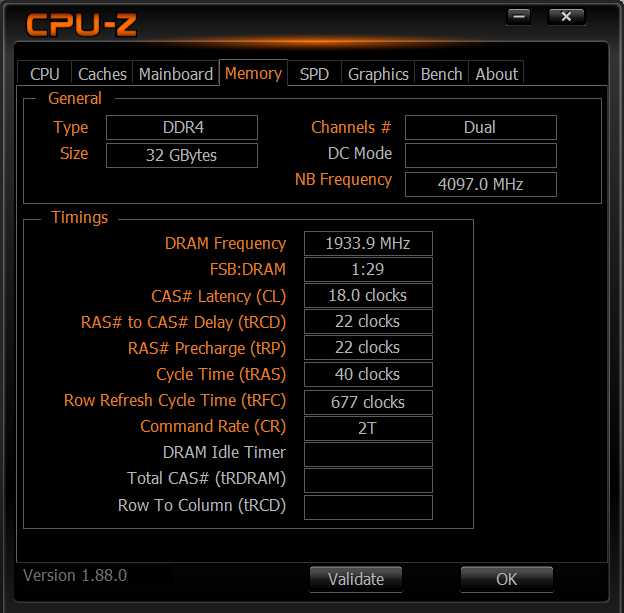
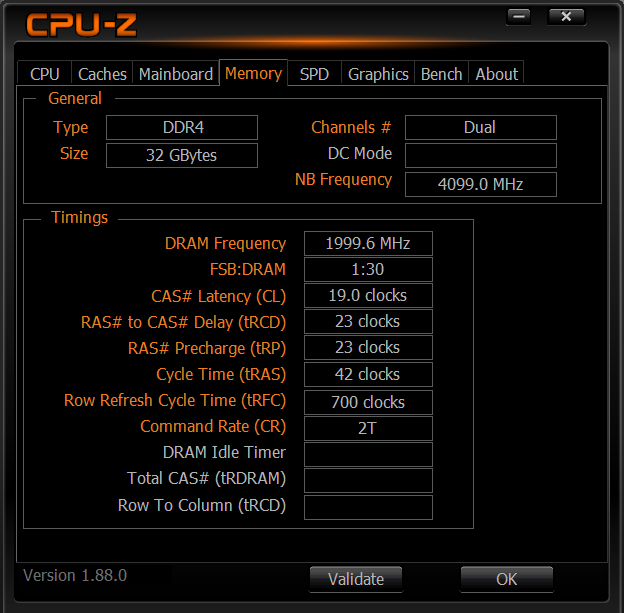
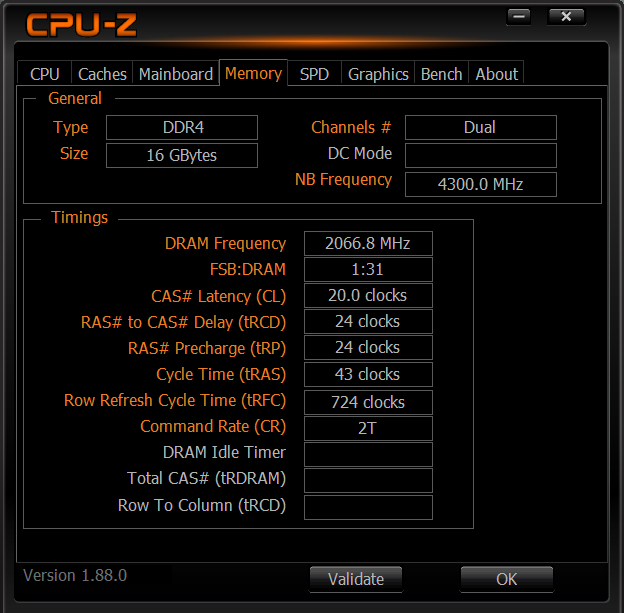
Both our I7 8700k and our I9 9900k were left at stock while overclocking the Viper Steel memory. Our I7 8700k boosted to 4.3 GHz and our I9 9900k boosted to 4.7 GHz. Our kit of Viper Steel did fairly well when it came to overclocking. However, it did better on the 9900k. On our I7 8700k, the Viper Steel DDR4 3866 was able to overclock to 4000 MHz. However, on the I9 9900k, the same kit was able to hit 4133 MHz. We were able to push the memory a bit further on each processor. However, on Si Soft Sandra, the benchmarks wouldn’t complete with the memory running any faster than 4000 MHz with the 8700k and 4133 MHz with the 9900k. So, these were the frequencies we stuck with. Our Viper Steel memory was able to hit 4200 MHz on the I9 9900k. We were able to run all benchmarks at this frequency except the suite on Si Soft Sandra Lite. Since these tests wouldn’t run, we went back to 4133 MHz. On the I7 8700k, The Viper Steel wouldn’t stay stable past 4000 MHz. The Voltage was left at the stock of 1.35 volts. Once I got the memory stable at 4133 MHz on the 9900k, I tried to tweak the voltage. However, it didn’t improve the frequency or the stability past 4133 MHz.
