Patriot Viper RGB DDR4 3200 MHz Memory Review.
Benchmarking and Overclocking
Overclocking
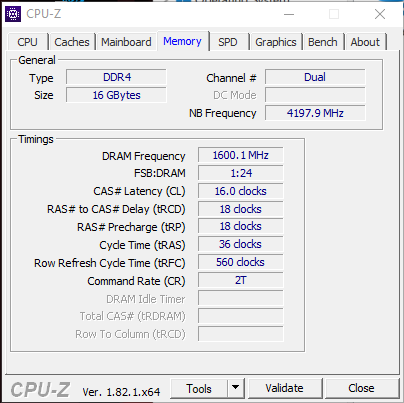
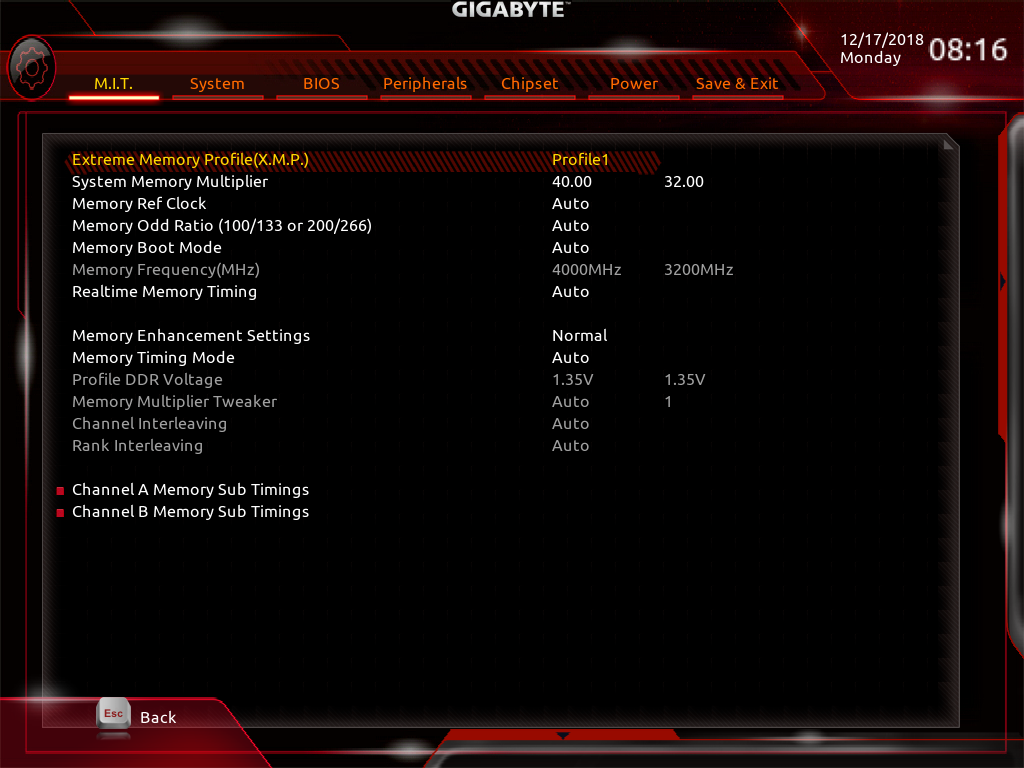
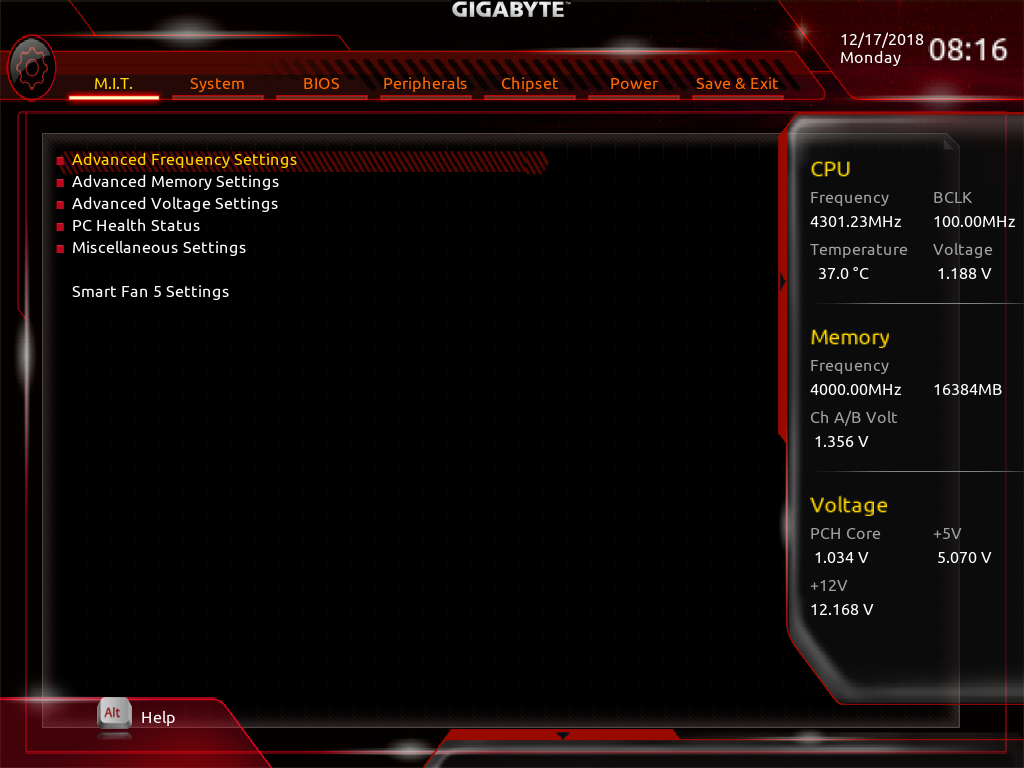
The first thing you should always do when installing new memory is to go into the bios and set your memory to extreme memory profile, or XMP #1. If you’re running a Ryzen system, it will be DOCP profile #1. This sets your memory to run at its advertised speeds. After running my first round of benchmarks, all at stock speeds, it’s time to start overclocking. This can be a long and tedious process. Especially with memory. With utilities such as Intel’s Extreme Tuning Utility, or XTU, you can now overclock your processor from your desktop. With memory, I always just go straight to the bios and start bumping up the multiplier bit by bit.
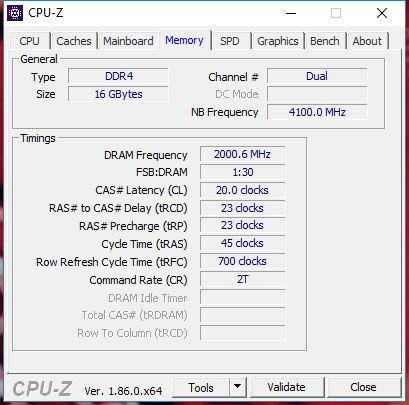
With the last kit of memory I personally reviewed, it wasn’t the best overclocking memory. That being the Patriot Viper LED memory. With that kit, the best I got was 3600 MHz at 1.38 volts. So, I hadn’t expected too much more than that out of this memory. However, I was wrong. The Patriot Viper RGB memory was able to overclock to 4000 MHz. I used ROG RealBench and Time Spy to validate each clock speed increase. Then, the entire suite of benchmarks to validate my highest, stable overclock. Hitting 4000 MHz stable makes the Viper RGB one of the best overclocking kits I’ve personally ever worked with. But, let’s see how it did with benchmarks.
Benchmarking
AIDA64 ENGINEER
AIDA64 has a set of several 64-bit benchmarks to measure how fast the computer performs various data processing tasks and mathematical calculations. Multi-threaded memory and cache benchmarks are available to analyze system RAM bandwidth and latency. Benchmark pages of AIDA64 Extreme provide several methods to measure system performance. These benchmarks are synthetic, so their results show only the theoretical maximum performance of the system. The AIDA64 suite has various benchmarks for CPU, FPU, GPU, storage and memory testing.
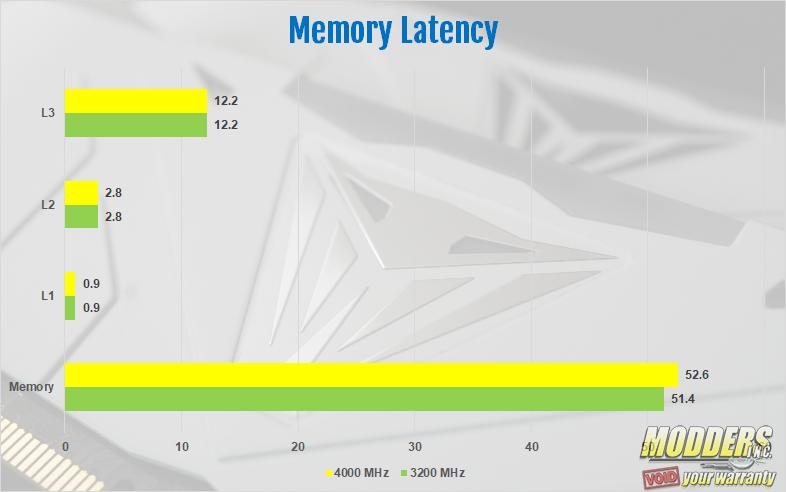
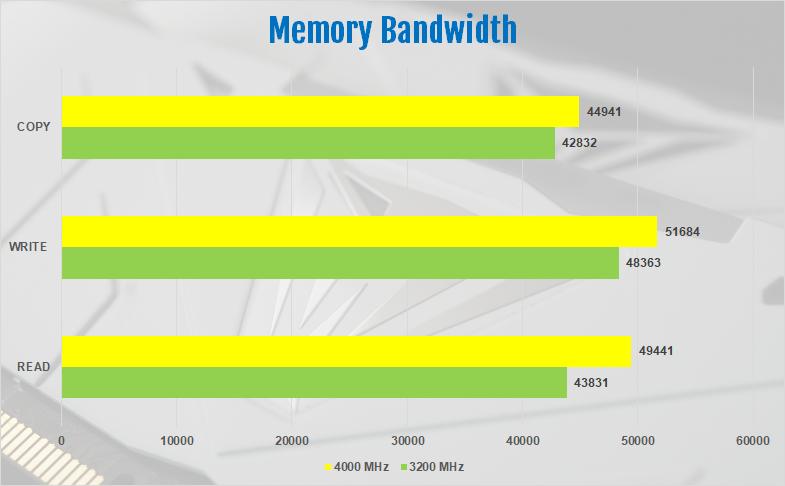
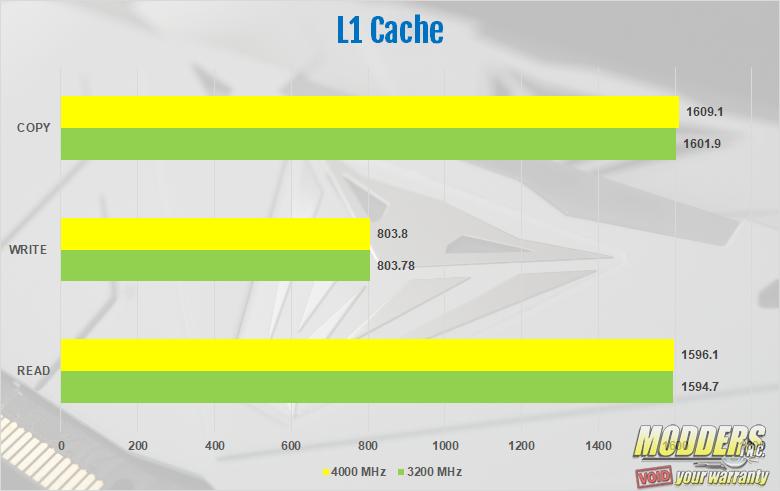
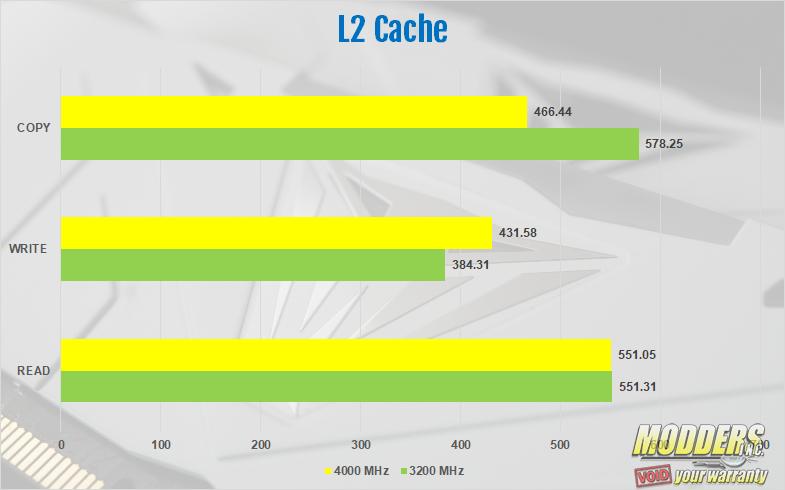
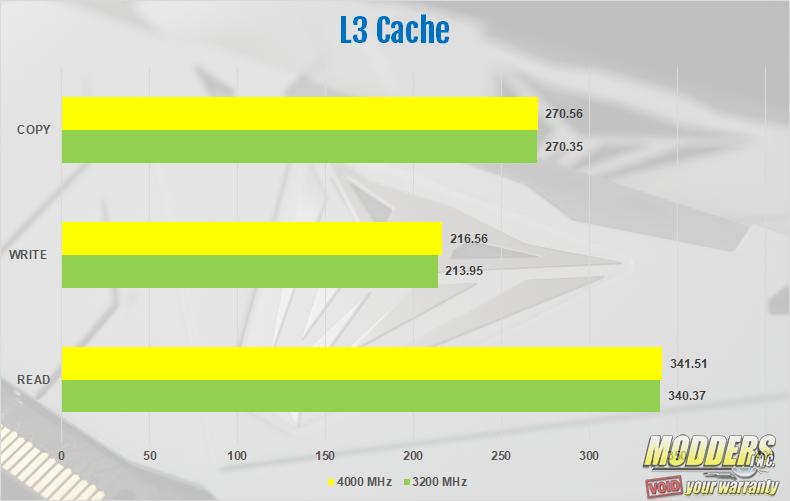
The first part of the AIDA64 memory test is the latency test. The latency is measured in nanoseconds. With XMP set to profile #1 and the memory running at 3200 MHz, the latency was 51.4 nanoseconds. On the memory bandwidth test, the Viper RGB kit we tested scored 43831 on the read, 48363 on the write and 42832 on the copy. With the memory overclocked to 4000 MHz, all results went up, even the latency. The latency hit 52.6 nanoseconds. Not much of an increase, but an increase either way. The read score was 49441, the write score was 51684 and the copy score was 44941. For the L1, L2 and L3 cache, the read, write and copy were identical. The results for L1, L2 and L3 cache were very close. The L2 cache was the results with the biggest differences. The results are in the charts below.
7-Zip
The 7-zip benchmark shows a rating in MIPS (million instructions per second). The rating value is calculated from the measured speed, and it is normalized with results of Intel Core 2 CPU with multi-threading option switched off. So, if you have modern CPU from Intel or AMD, rating values in single-thread mode must be close to real CPU frequency. There are two tests, compression with LZMA method and decompression with LZMA method. Once the total passes reach 100, the score is taken. 7-Zip gives the resulting score for decompressing, compressing and an overall score. At the memories stock speed, the 8700k achieved a decompressing score of 34846, a compressing score of 35809 and a total rating of 35328. With the memory running at 4000 MHz, the decompressing score went down a bit to 34524. The compressing score went up quite a bit to 37005. The overall rating was close but still went up to 35764.
SiSoft Sandra Lite
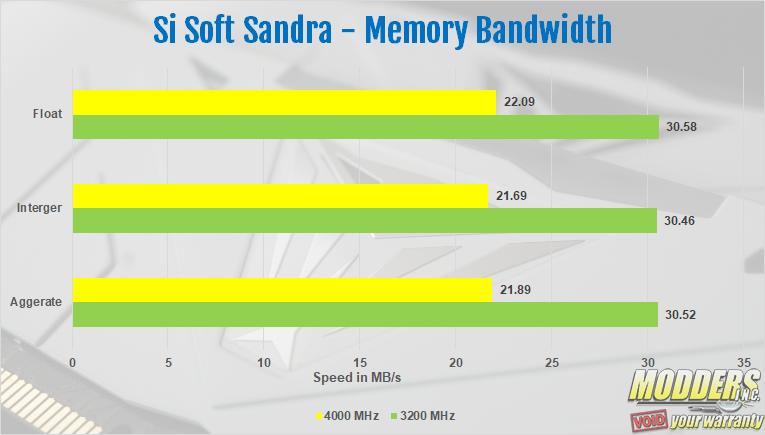
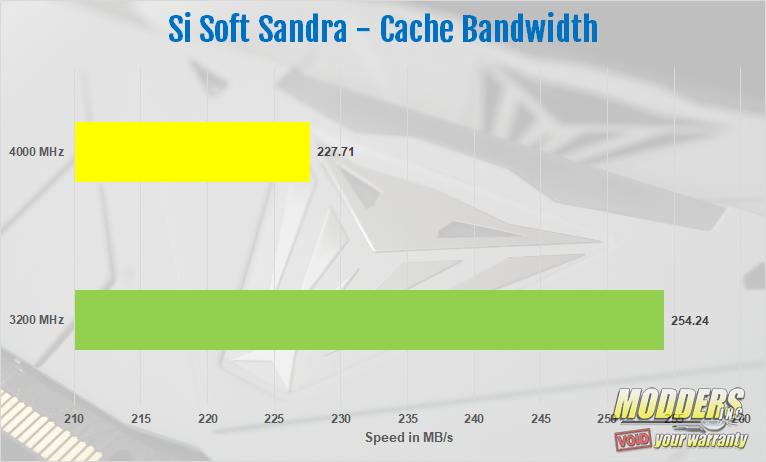
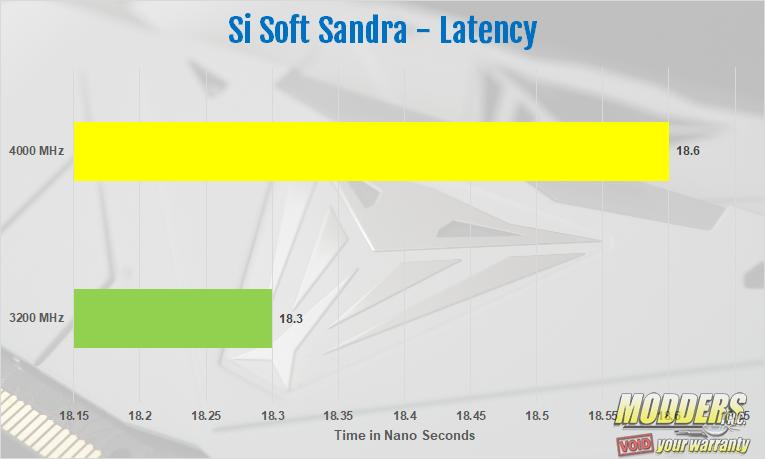
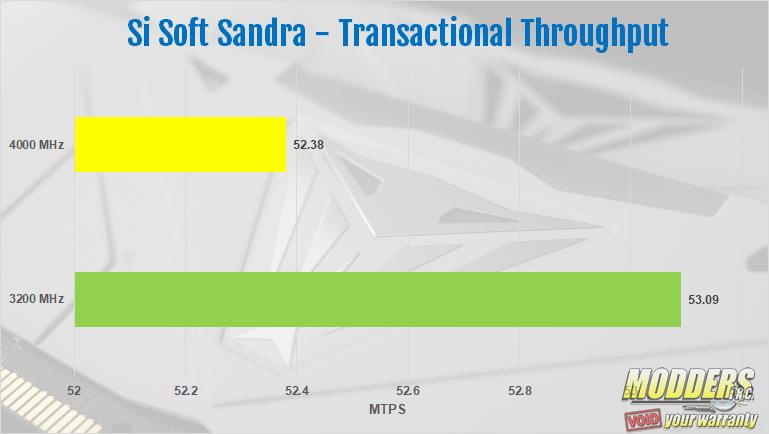
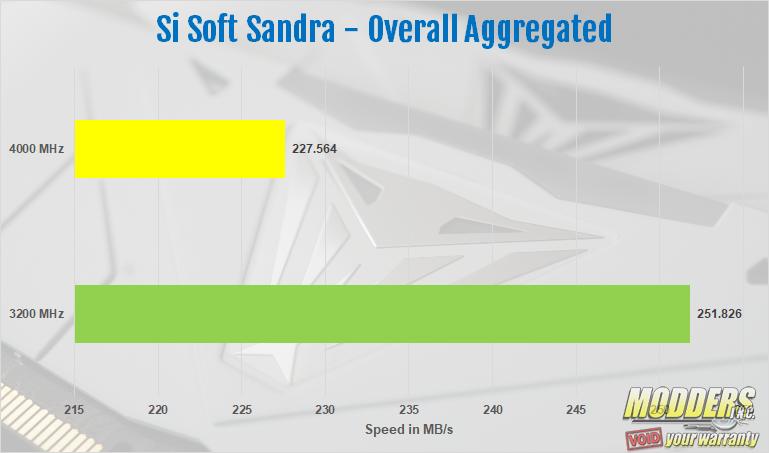
Sandra Lite is a free version of SiSoft’s Sandra testing suite. Sandra Lite is a synthetic benchmark program that has its own set of system memory specific benchmarks. Aggregated scores of the Memory bandwidth performance in Gigabytes per second and Memory Transaction Throughput in total throughput per second are measured (higher is better). I ran the benchmarks for Si Soft Sandra several times each. Every time I came up with the same results. The Viper RGB did better in Si Soft Sandra running at its advertised speeds of 3200 MHz. At first, I thought if I lower the clock speed a bit from 4000 MHz, that the results would improve. They did, but just slightly. Point being that the higher the speed went, the worse the scores got all around. The best scores I achieved with Si Soft Sandra were with the memory simply running XMP profile #1 at 3200 MHz.
ROG Realbench
ROG Realbench is an open source program, designed to test your PC as it would run in real-world scenarios. It’s a semi-synthetic testing suite that collects four different programs and can perform controlled runs of each related to image editing (GIMP), video encoding (Handbrake H.264), OpenCL (Luxmark) and Heavy Multitasking (Combination of all three at the same time). For this review, we only recorded the Image Editing result. This is because the Image Editing test in RealBench is very memory intensive.
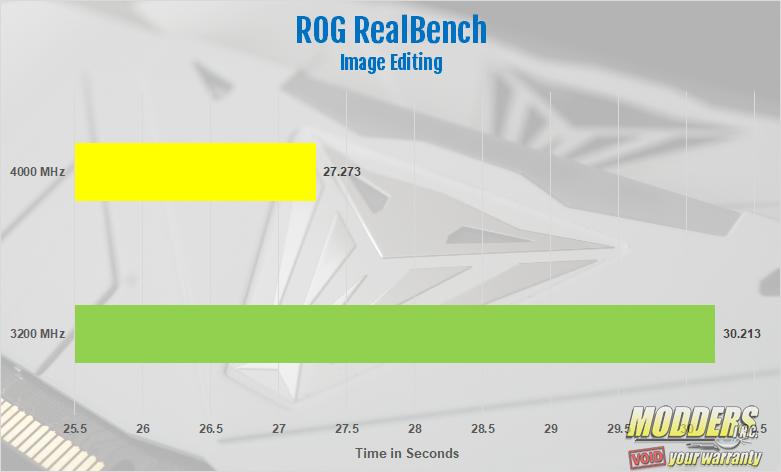
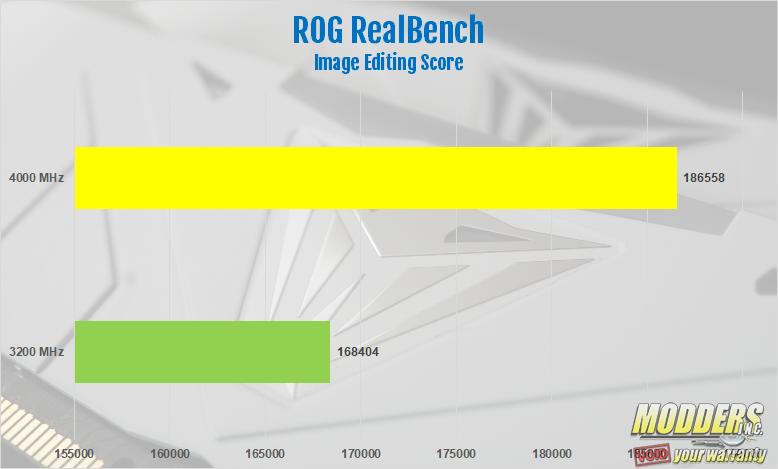
The two charts show both the image editing score, as well as the time the benchmark took to run. From my testing, the ROG Realbench Image editing test benefited from the faster memory speed. Not only was the score higher at 4000 MHz, but it also took less time to complete the benchmark. At its stock speed, the Viper RGB memory took about 30 seconds to complete the image editing benchmark and scored 168404. Overclocked to 4000 MHz, the Image Editing test took about 27 seconds to complete and scored 186558.
Passmark Performance Test – Memory Mark – Threaded
“Fast, easy to use, PC speed testing and benchmarking. PassMark PerformanceTest ™ allows you to objectively benchmark a PC using a variety of different speed tests and compare the results to other computers.” Performance Test 9.0 is an overall benchmark that tests every area of your PC. With this being a memory review, we decided to not run the entire suite of tests in Performance Test 9. Instead, we only ran the Memory Mark test. However, there are several sections to this test.
As I had expected, the Viper RGB scored better in Passmarks Memory Mark test in Performance Test 9. The biggest difference was in the memory threaded test. At stock speeds, the Viper RGB scored 40118. Overclocked to 4000 MHz, it scored 41994 in that same test. The overall Memory Mark score was also a bit higher while overclocked. At 3200 MHz the memory mark score was 3429. Overclocked, the score was 3460.
3DMARK Time Spy
3DMark is a computer benchmarking tool used to determine the performance of a computer’s 3D graphics rendering and CPU workload processing capabilities. It does this through a series of graphics and CPU tests. For this review, we ran only Time Spy. Usually, I’ll give two results. The first result being with all components at stock. The second results usually have the CPU, GPU and memory overclocked as far as they’ll go. However, for this review, only the memory was overclocked. One result is with the memory on XMP profile #1 running at 3200 MHz and the second with the memory running at 4000 MHz.
There were slight differences between the stock and overclocked results. The CPU score saw the greatest difference with a stock score of 7586 and an overclocked score of 7923. The overall score was very close. The stock score was 10044 and the overclocked score was 10100.
