Patriot Extreme Performance Viper DDR3 6GB PC3-12800 DIMM Kit
Observation
| The Test Rig:
Intel Core i7 920 @ 2.66 GHz
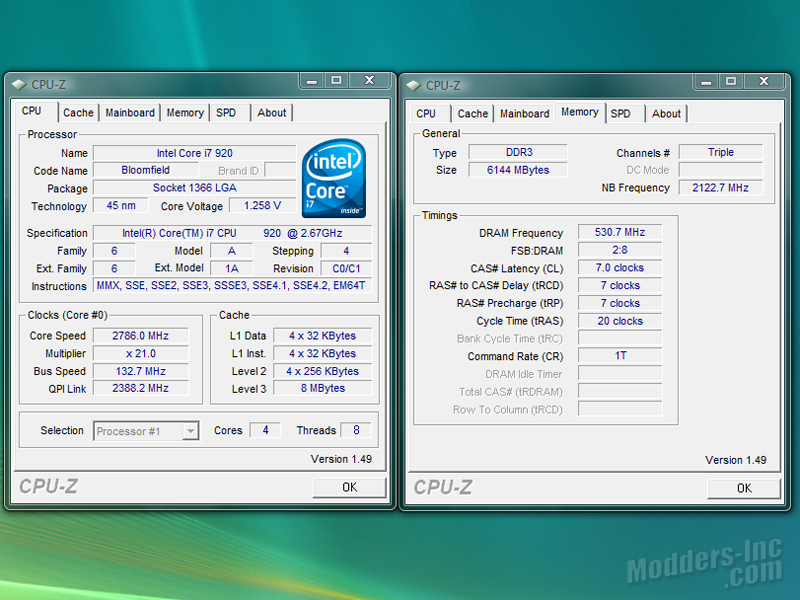 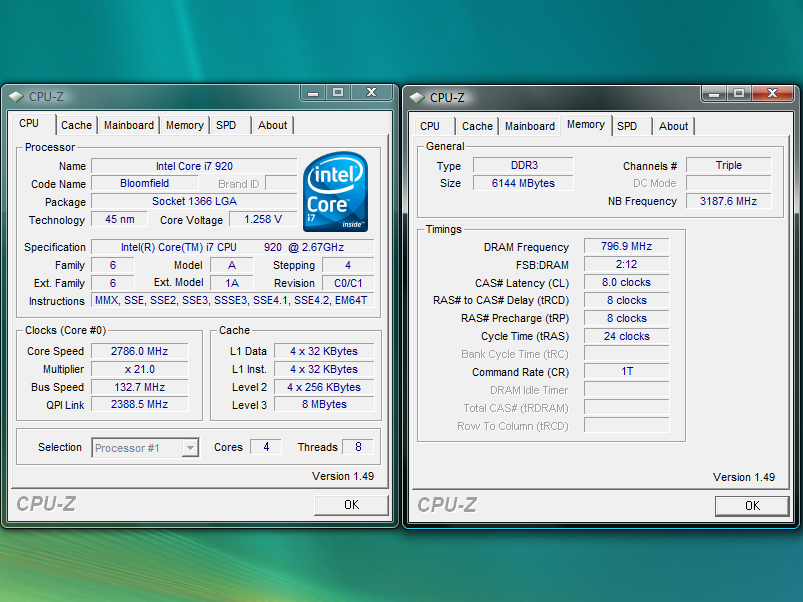 Clickfor larger images. The first screenshot shows what the Corei7 920 booted up at with the Patriot modules installed. Even though our memory is DDR3 1600MHz, we can see that it defaulted to DDR3 1066MHz speeds. The second screenshot shows the modules at their rated DDR3 1600MHz speed. I simply increased the DIMM Voltage to 1.625V (which shows as 1.65V via the OS) and took a few of the other settings off of Auto.
Seeing that I don’t have any comparison modules to run head to head against the Patriot’s at this time, I will be simply running these at the 1066Mhz, 1333MHz, and 1600MHz speeds. I will be using a few different programs to see how the Patriot Extreme Performance Viper modules handle the different speed settings. The first application will be Sandra Lite V 2009.1.15.42 (Int & Float Buffered). The second application will be Everest Ultimate Edition V 5.00.1650 (Read, Write, Copy, and Latency). Next we have PassMark Performance Test V 6.1 (Uncached Read, Write, and Memory Mark). Finishing up with a loop of Far Cry 2’s Benchmark Tool (3 passes with Ranch Medium).
SiSoftware Sandra:
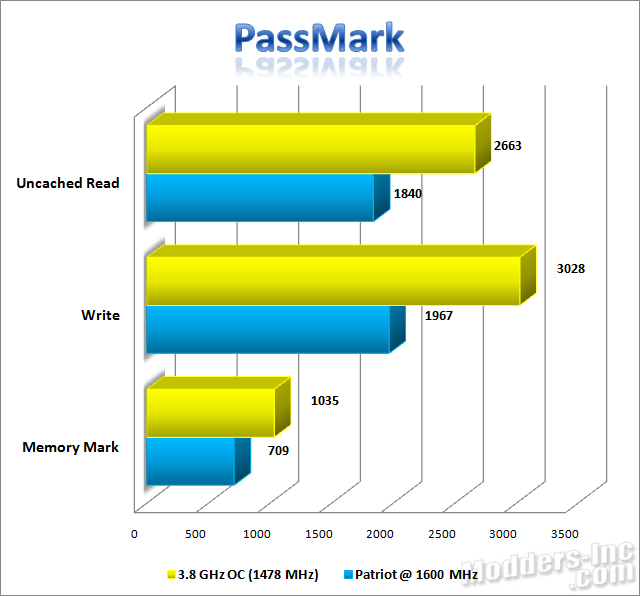
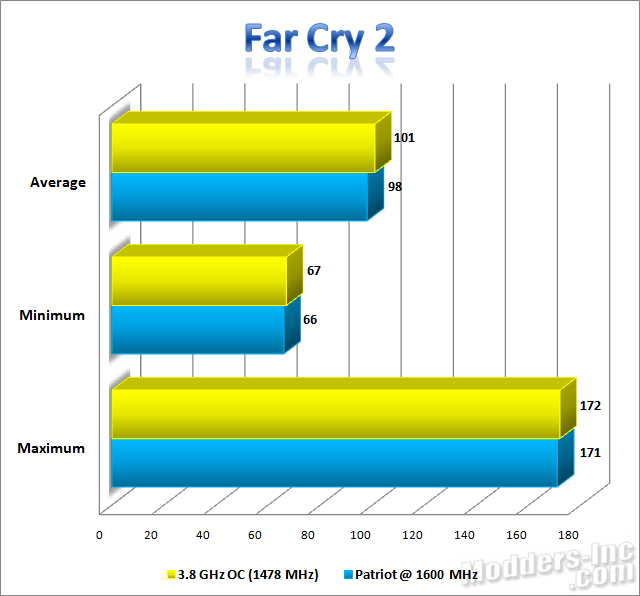
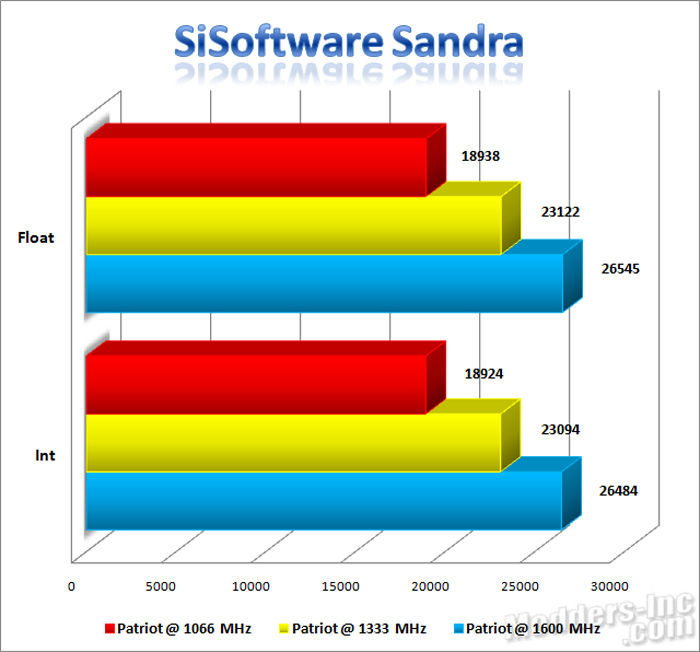 Click for larger image. SiSoftware Sandra (System ANalyser Diagnostic Reporting Assistant) is a synthetic benchmark that features several tests that are used to evaluate different areas of the PC. Using Sandra to benchmark the different speeds of the Patriot Vipers, we can see that we achieved a 22% increase in performance from the Core I7’s default 1066 MHz to 1333 MHz. Then bumping up from there to the rated speed of 1600 MHz on the Patriot Vipers, we gained another 18% in performance. Thats a total of 40% increase by simply setting the Patriot modules to their rated speed. Everest Ultimate: 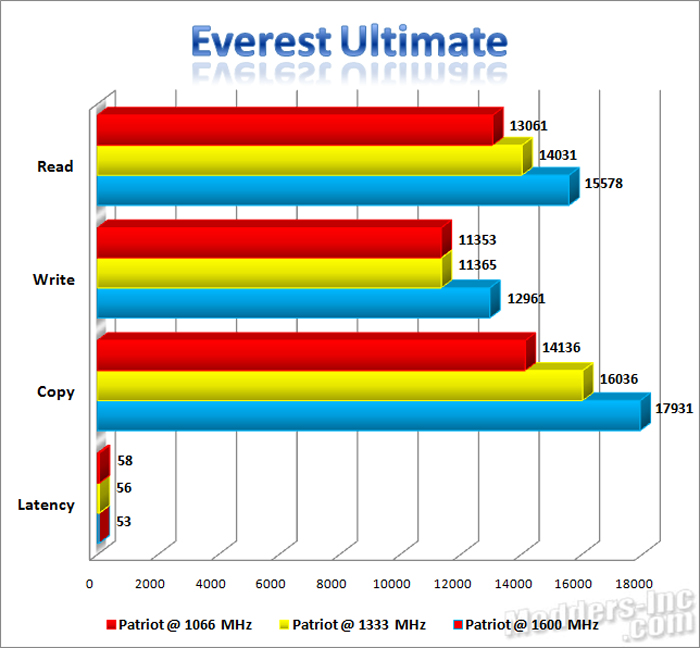 Click for larger image. Everest Ultimate Edition is one of the leading system diagnostic and benchmarking solutions for PC enthusiasts. Everest offers users essential system and overclocking information during system optimizations and tweaking. With it’s advanced hardware monitoring, and diagnostic capabilities, it makes an ideal application to use for comparisons against other systems, or configurations. Looking at the chart above, we can see that the system showed and increase in performance in the range of 10 – 25% in areas. PassMark: 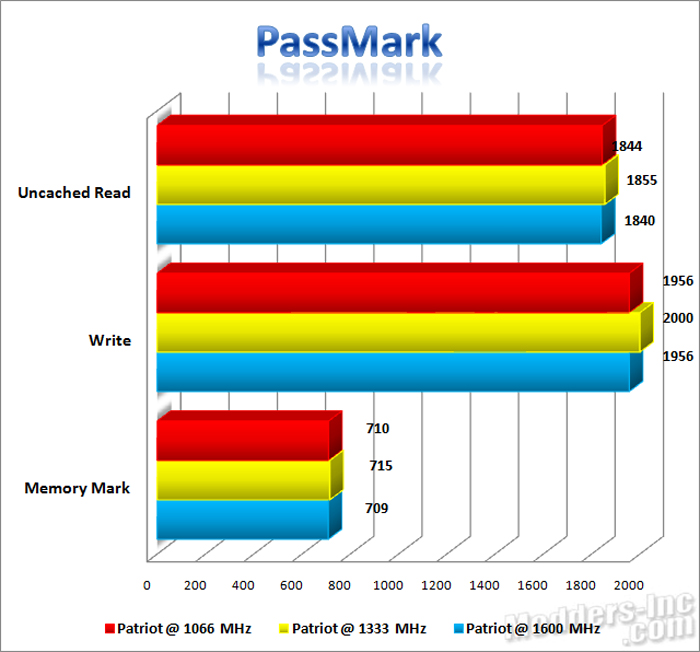 Click for larger image. PassMark Performance Test is another hardware benchmark utility that allows us to easily measure the performance of the computer. Although we see that our results are slightly different on the Patriot modules this time. We see a drop from the slowest speed to the fastest speed of less than 1%, which is likely due to other system processes running at the same time. However PassMark shows that our best performance was at the 1333 MHz settings. Far Cry 2: 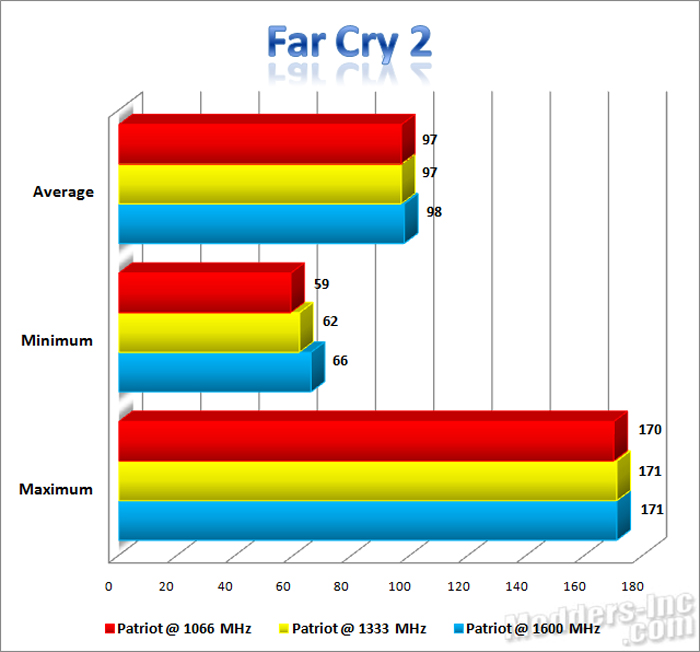 Click for larger image. Moving on to some actual game testing. Far Cry 2 is Ubisoft’s award winning first person shooter, that gives new meaning to realistic destructible environments. With its effects such as non-scripted AI, real-time night and day cycle, awesome fire propagation, and storm effects. It’s definitely a sign of whats to come in future games. Using Far Cry’s included benchmark tool, we pre-set the games settings to a resolution of 1920×1200 with 4X Anti-Aliasing, and set the Performance settings to Very High, while setting the Quality settings to High. As we can see in the above charts, the Core i7 / BFG GTX295 rig pulled in a nice 97-98 frames per second. It wasn’t a surprise to me to see so little change in the performance. Bumping up from 6GB to 12GB might have given us a little better result. Overclocking: When attempting to overclock the memory modules by themselves, I realized even though these modules have the Micron D9JNL chips, they didn’t want to go over the rated 1600 MHz speed settings. It didn’t matter what way I went about trying to increase the modules speed, once I broke the 1600 MHz mark, the system would become unstable. Moving along though, I did want to see how well the system would overclock in general (not just the memory). I was able to tweak the Core I7 920 setup to 4.0 GHz on air cooling. This for some has proven to be a challenge, while others have had no problems. At 4.0 GHz, mine does run a little warmer than what I have seen most report by others. For testing purposes though, I decided to back it down just a little to 3.8 GHz, which seemed to provide adequate load temps. 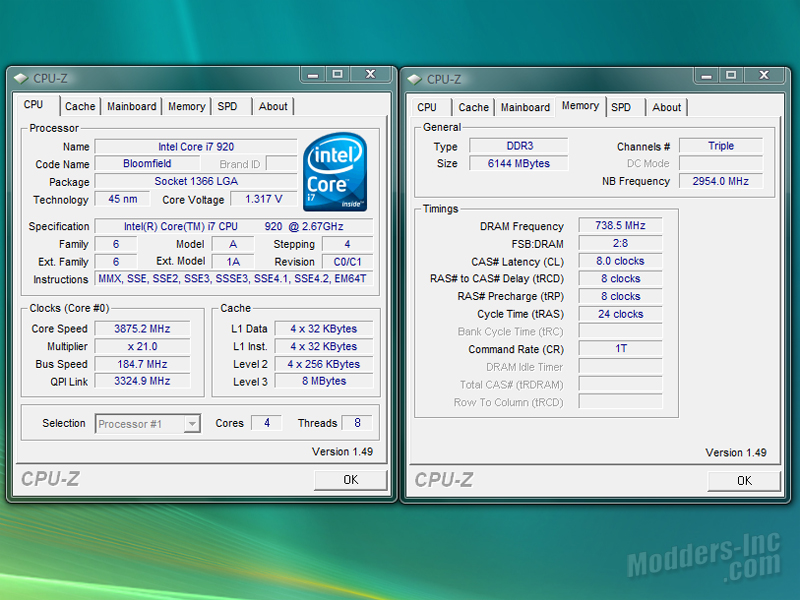 Click for larger image. The 3.8 GHz system OC required only a few minor changes. CPU Clock Ration @ 20x, with a CPU Host Frequency of 185, Memory Frequency of 2:8, and increased the CPU VCore Voltage to 1.3125. Everything else runs at relatively stock settings. For this comparison, we will show the OC’d 3.8 GHz (1478 MHz) vs the Patriots at their rated 1600 MHz speeds. 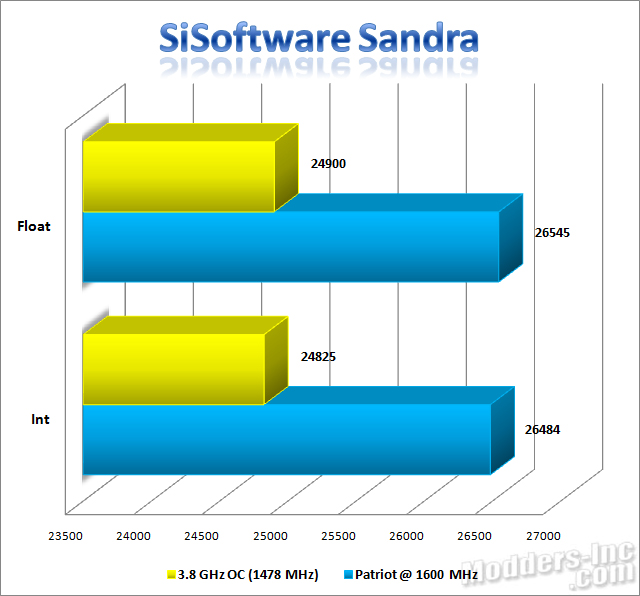 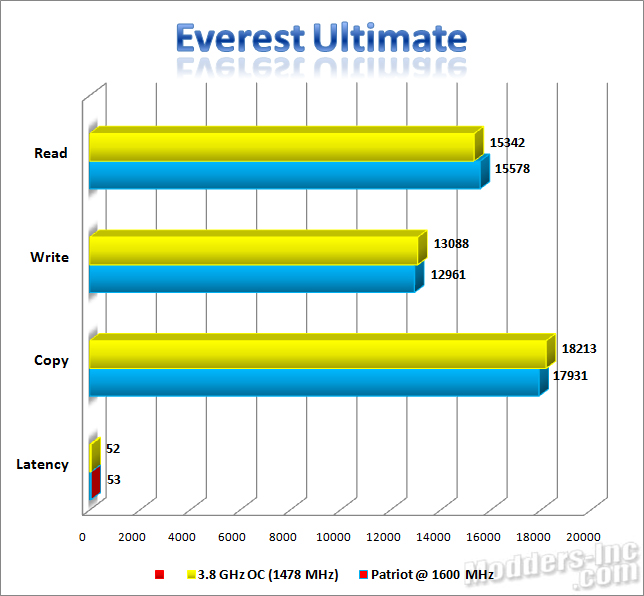
As we can see in the above charts, the results are a bit mixed with the overall system OC. SiSoftware Sandra shows the increased MHz of the Patriot modules performing the best with a 6% lead over the OC’d 3.8 GHz. Everest Ultimate carried a 1% increase @ 1600 MHz, while the OC’d settings achieved a 1% advantage with Copy, Write, and Latency. PassMark Performance Test on the other hand, showed a significant increase of 44 – 53% increase across the board, which tells us that its more CPU based than memory based. In Far Cry 2 we see the OC’d settings taking the advantage on average by 3%.
Had we been able to OC the Patriot DDR3 PC3-12800 modules to 1700 MHz or more, we would have seen a larger performance increase. Keep in mind though, not all hardware overclocks the same. It really boils down to the luck of the draw. You might have a Core i7 920 that can hit 4.6 GHz while the next 1000 guys can only hit 4.2 GHz. The best you can do is watch the trend and see how good of results others are getting. Then make your purchased based on that information. Don’t bank on it though. |
