MSI Z97 Gaming 9 AC: Jack of All Trades
Subsystem Testing and Gaming Benchmarks
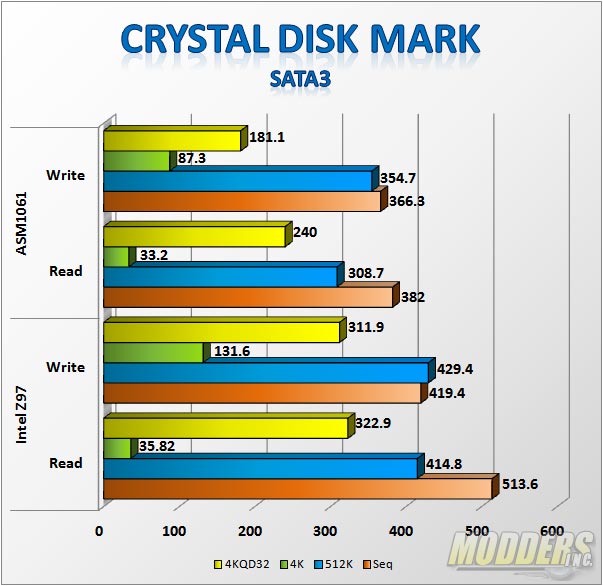
Six SATA3 connections on the MSI Z97 Gaming 9 AC are provided by the Intel chipset while an ASMedia ASM1061 provides two more.
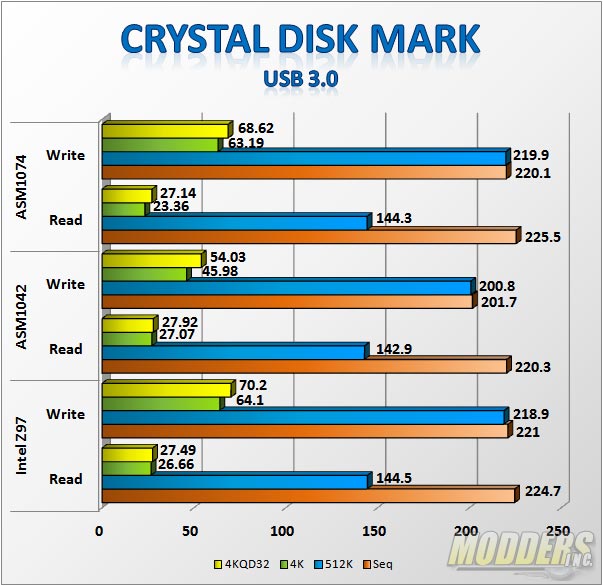
Aside from the native USB 3.0 ports from the on-board headers, MSI provides extra ASMedia controlled USB 3.0 ports in the rear I/O:
The extra ASMedia USB 3.0 ports showing great numbers close to the native Intel USB 3.0 performance. I can see why MSI chose to use ASM1074 for six of the USB 3.0 ports since it is faster than using ASM1042.
DPC Latency
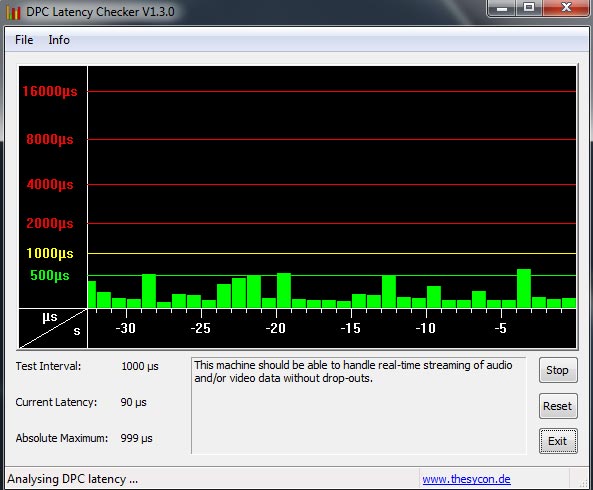
Before proceeding with audio benchmarks, Deferred Procedure Call latency must be first checked to make sure that the system is capable of producing useable results when the Rightmark Audio Analyzer benchmark was run. DPC is a Windows function that involves prioritizing tasks within the OS and high DPC latencies can be caused by several things including hardware device conflict. The DPC checker graphically displays the latency level of the system in real time so as long as the bars are in the green, the system should be able to handle audio and video streaming without drop outs or stutters.
It certain is the highest I have ever seen, topping just below the 1000µs mark at 999, but that was rare and most of the highs are just over 500µs. Still, this is the highest latency I have observed by far on a Z97 motherboard although it is still within range for real-time audio streaming.
RightMark Audio Analyzer
This is a simple loopback test with the output connected to the line-in jack. All effects are disabled and all software post processing were disabled. Direct power feature was used with a MOLEX plugged into the supplied connector for isolated power.
Audio Boost 2 (Realtek ALC1150):
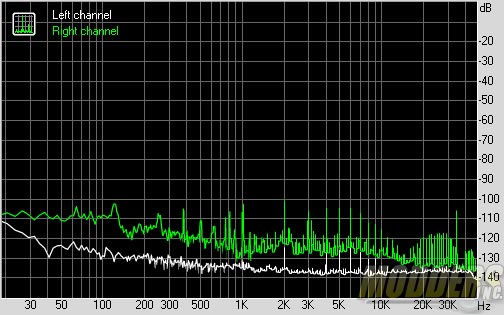
I was having issues with my particular Z97 Gaming 9 board as the right channel on the speaker was producing a significant amount of noise. The right channel on my test motherboard was weaker by 30% compared to the left channel and had a lot of distortion, audibly and visible with the RMAA graphs. I checked this with MSI motherboard tech team to verify if they are also seeing it but they are unable to replicate my issue. At the last minute I managed to find somebody with an MSI Z97 Gaming 9 on hand in my town and had him perform the test for me to have a second opinion. It looks like my sample is the only one with this issue and it appears isolated. The results of the tests are below for comparison:
| 24-bit, 96 kHz (motherboard sample with defective right channel) |
||
| Frequency response (from 40 Hz to 15 kHz), dB |
-5.51, -5.66
|
Excellent
|
| Noise level, dB (A) |
-98.4
|
Excellent
|
| Dynamic range, dB (A) |
98.2
|
Excellent
|
| THD, % |
10.072
|
Very poor
|
| THD + Noise, dB (A) |
-17.6
|
Very poor
|
| IMD + Noise, % |
0.023
|
Good
|
| Stereo crosstalk, dB |
-82.3
|
Very good
|
| IMD at 10 kHz, % |
7.976
|
Very poor
|
| General performance |
Very Good
|
|
The weird thing is that MSI’s internal testing produced worse results in some aspects but did not display the large amount of distortion on the right channel as mine did.
| 24-bit, 96 kHz (from MSI internal lab tech tests with different Z97 Gaming 9) |
||
| Frequency response (from 40 Hz to 15 kHz), dB |
+5.43, +4.24
|
Very poor
|
| Noise level, dB (A) |
-103.8
|
Excellent
|
| Dynamic range, dB (A) |
103.7
|
Excellent
|
| THD, % |
0.0076
|
Very good
|
| THD + Noise, dB (A) |
-79.4
|
Average
|
| IMD + Noise, % |
10.539
|
Very poor
|
| Stereo crosstalk, dB |
-9.8
|
Very poor
|
| IMD at 10 kHz, % |
6.081
|
Very poor
|
| General performance |
Average
|
|
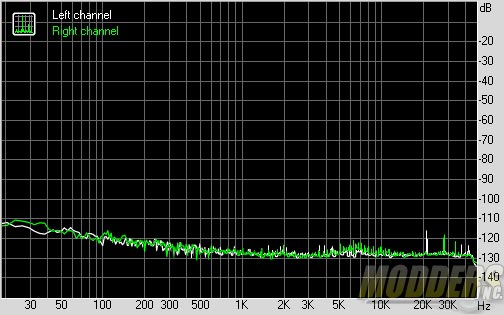
Results are a lot more normal on the 3rd MSI Z97 Gaming 9 AC tested with no abnormal noise levels detected.
| 24-bit, 96 kHz (from different retail MSI Z97 Gaming 9 AC tested) |
||
| Frequency response (from 40 Hz to 15 kHz), dB |
+0.01, -0.06
|
Excellent
|
| Noise level, dB (A) |
-96.6
|
Excellent
|
| Dynamic range, dB (A) |
96.6
|
Excellent
|
| THD, % |
0.0081
|
Very good
|
| THD + Noise, dB (A) |
-78.3
|
Average
|
| IMD + Noise, % |
0.0095
|
Very Good
|
| Stereo crosstalk, dB |
-93.3
|
Excellent
|
| IMD at 10 kHz, % |
0.013
|
Very Good
|
| General performance |
Very Good
|
|
The results are now more in line with what is expected from MSI’s Audio Boost 2 design as is seen in previous MSI motherboard reviews. In subjective listening tests, the Audio Boost 2 is easily superior compared to older motherboard audio designs, even with some ALC1150 implementations and lends itself well for gaming use with a healthy amount of bass (even with the budget Sony MDR-XD100 headphone) although lacking in richer details that are apparent at higher resolution as expected.
Xtreme Audio DAC:
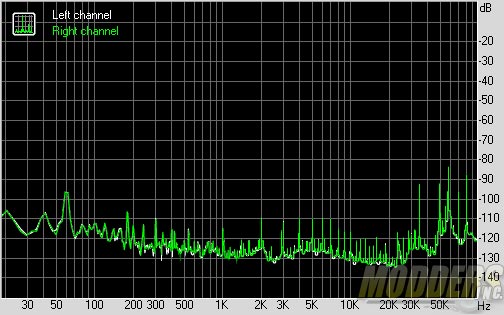
The Xtreme Audio DAC has much beefier hardware and produced good results, although the RMAA’s and the loopback tests’ shortcomings show as it is inadequate in assessing how the system actually performs so listening tests will also be included. Same methodology is used but the linein on the Realtek was plugged in since the input on the Xtreme audio DAC is a microphone input.
| 24-bit, 96 kHz |
||
| Frequency response (from 40 Hz to 15 kHz), dB |
+0.03, -0.07
|
Excellent
|
| Noise level, dB (A) |
-101.4
|
Excellent
|
| Dynamic range, dB (A) |
94.7
|
Very good
|
| THD, % |
0.013
|
Good
|
| THD + Noise, dB (A) |
-75.2
|
Average
|
| IMD + Noise, % |
0.020
|
Good
|
| Stereo crosstalk, dB |
-89.5
|
Excellent
|
| IMD at 10 kHz, % |
0.075
|
Good
|
| General performance |
Very good
|
|
| 24-bit, 192 kHz |
||
| Frequency response (from 40 Hz to 15 kHz), dB |
+0.02, -0.05
|
Excellent
|
| Noise level, dB (A) |
-96.9
|
Excellent
|
| Dynamic range, dB (A) |
95.9
|
Excellent
|
| THD, % |
0.017
|
Good
|
| THD + Noise, dB (A) |
-72.8
|
Average
|
| IMD + Noise, % |
0.025
|
Good
|
| Stereo crosstalk, dB |
-90.2
|
Excellent
|
| IMD at 10 kHz, % |
0.080
|
Good
|
| General performance |
Very good
|
|
The downside is that despite the good results, the Xtreme Audio DAC relies on the chassis’ front panel connectors so obvious noise is introduced after the stage before it reaches the headphones.
With the subjective listening tests, I expected the Xtreme Audio DAC to be tuned for gaming but there is a surprising warmth to the sound and it certainly is pushing the boundaries of on-board audio. The bass is not overpowered and surprisingly well-defined with a very clear midrange, resulting in well-defined vocals or dialogue for movie watching. The highs show no distortion at their peaks as well. The most apparent difference is in the sound staging and has richer details and fuller sound compared to the Audio Boost 2 solution. Audio sources that are not very good are immediately obvious. The drawback to using the stock front panel headphone connectors instead of providing a shielded dedicated breakout box however is also apparent in listening tests with more distracting perceptible noise than the Audio Boost 2 solution. Since front panel connectors inside cases often share the same PCB as a USB port or two as well, this compromised output will be a common occurrence.
Network Connectivity
Network testing was conducted with a 4-port Cisco E3200 Gigabit Dual-Band Wireless N router and a pair of 10-ft long Cat5E cables connecting the server PC and the test motherboard. The server system is running an Intel Core i7-3960X processor on an ASUS P9X79 WS motherboard with an Intel 82574L Gigabit LAN Controller. Interrupt Moderation was disabled.
Wireless tests were conducted with the router placed 10-feet away from the test system with one wall separating the two. 2.4GHz and 5GHz set of tests were used. The Cisco E3200 router is not the fastest router in the market but it is a typical Wireless N router so performance results would be comparable to most real-world mainstream wireless use. The test was also conducted in a crowded suburban neighborhood with a very busy wireless traffic.
Killer Gigabit LAN:
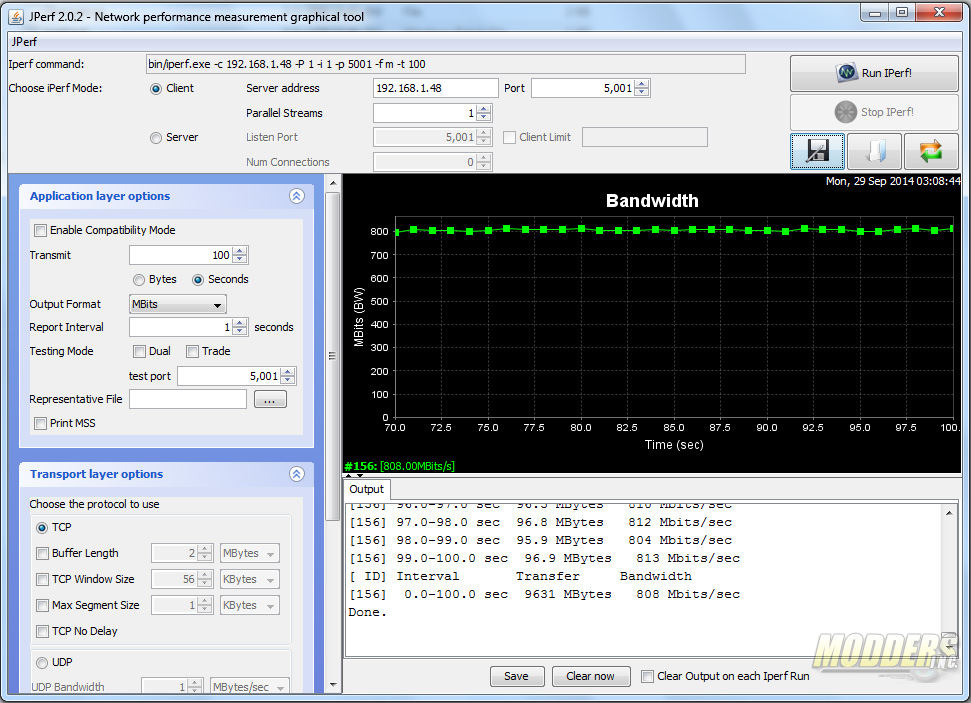
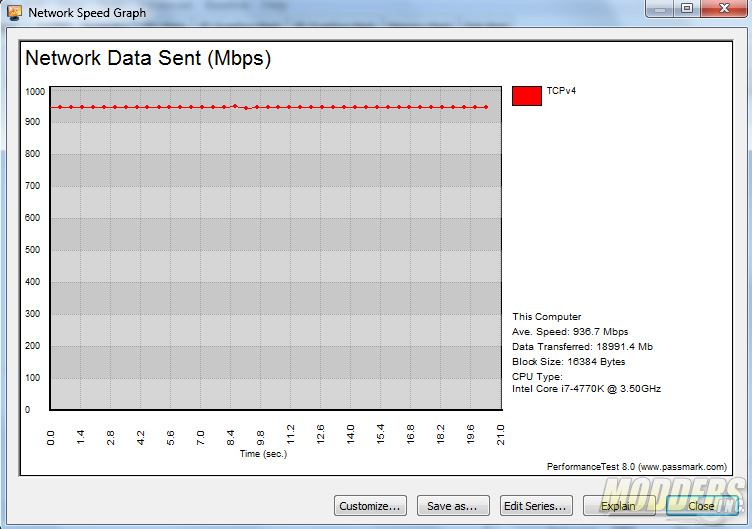
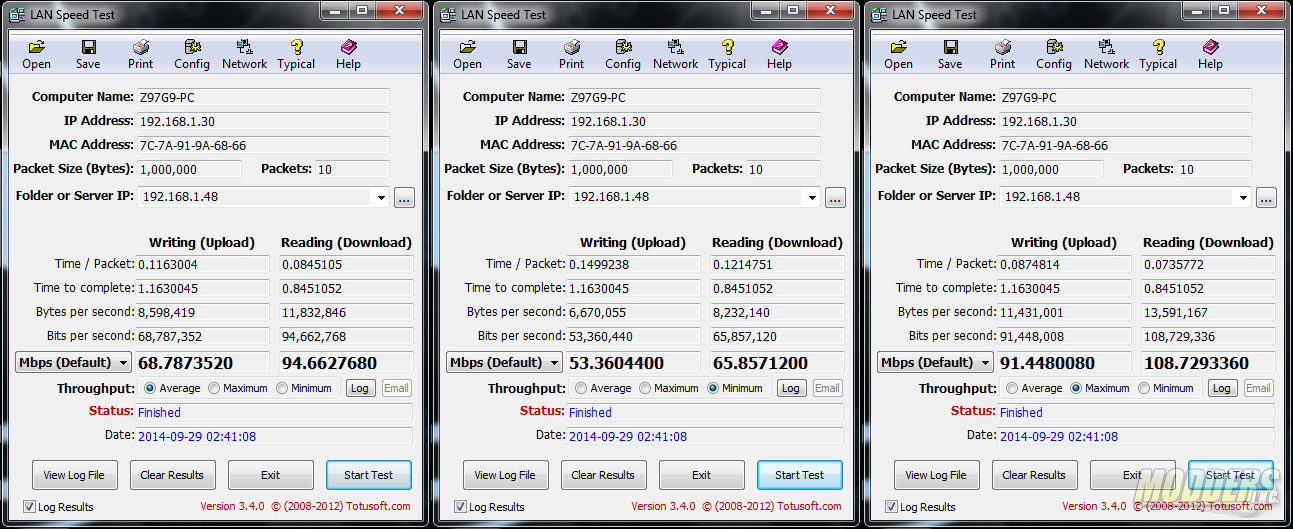
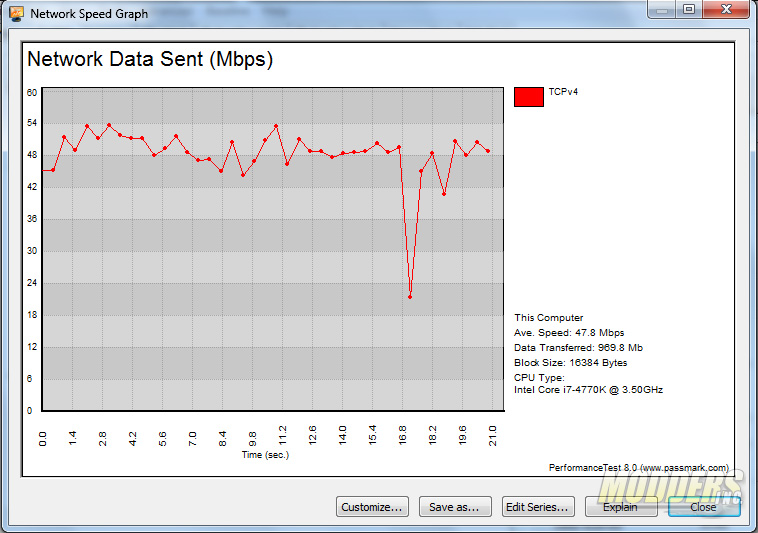
Extremely good results with the Killer E2205 Gigabit LAN. The biggest drawback instead of using Intel Gigabit Ethernet like the one found on the MSI OC series is that CPU utilization is higher, peaking at 17% CPU load unlike Intel implementations which can use as low as 1% in some instances. Both jPerf and Performance Test Network Speed Graph display a smooth transfer rate with no dips and starting at a high rate already from the get go.
Intel Wireless AC 2670 2.4GHz:
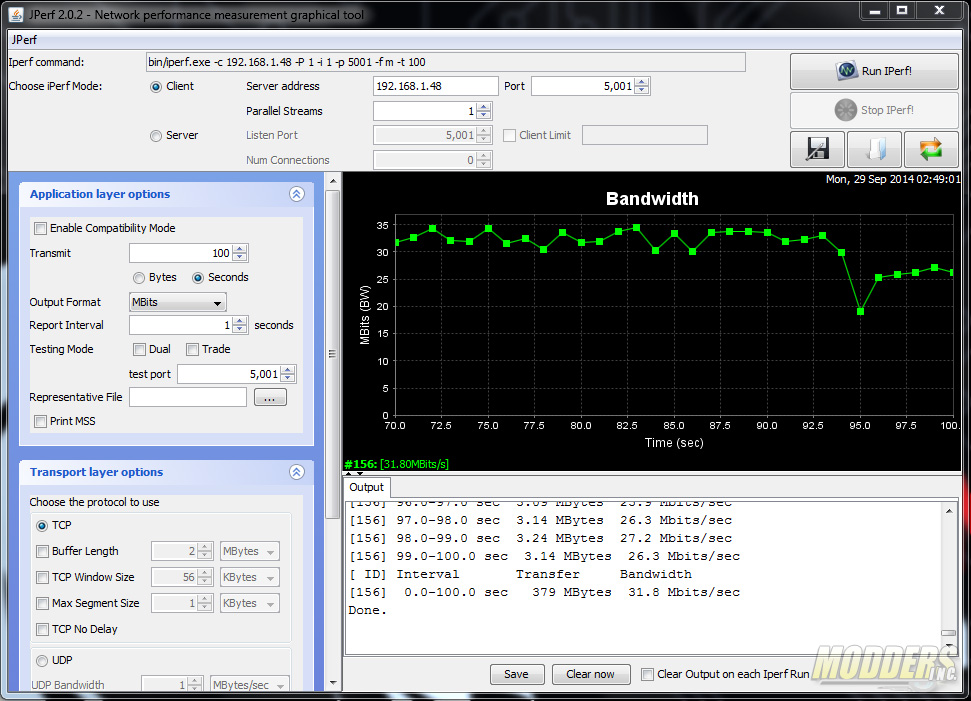
The limitations of using an 802.11n router notwithstanding, the Intel AC 2670 adapter performed decently despite the heavy 2.4GHz traffic, CPU usage peaked at 8%. Performance would be smoother on the 5GHz band and also faster with an 802.11AC router.
Gaming Tests
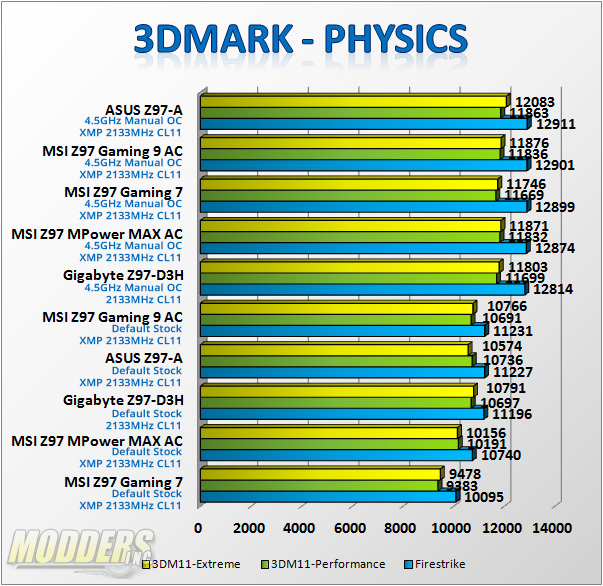
Futuremark’s 3DMark is a semi-synthetic gaming benchmark that calculates both graphics and CPU-bound physics in a controlled series of tests and provides scores that can be compared with other gaming platforms. Since this is a motherboard benchmark, the CPU score is what is the most relevant with Physics scores advancing forward per MHz added to the CPU frequency. 3DMark Firestrike, 3DMark 11 Performance preset and Extreme preset were used.
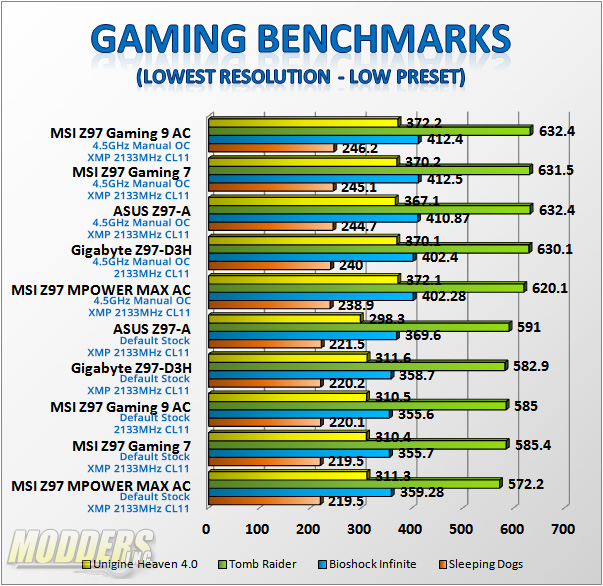
A gaming test at the lowest resolution was performed instead of a “real-world” test. CPU performance difference can be gauged due to the reduced reliance on the discrete GPU at those low levels.
