CPU Testing
AIDA64 ENGINEER
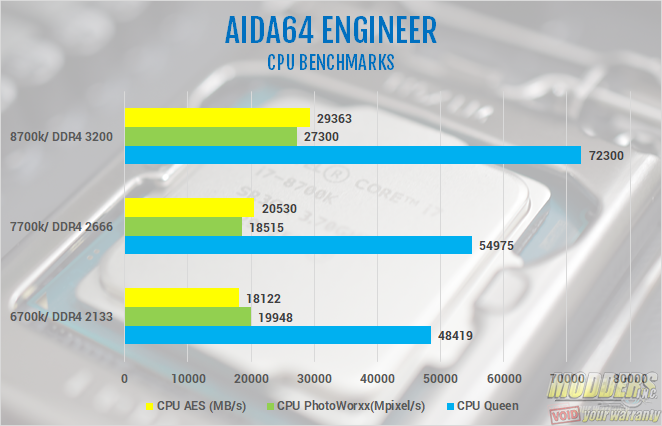
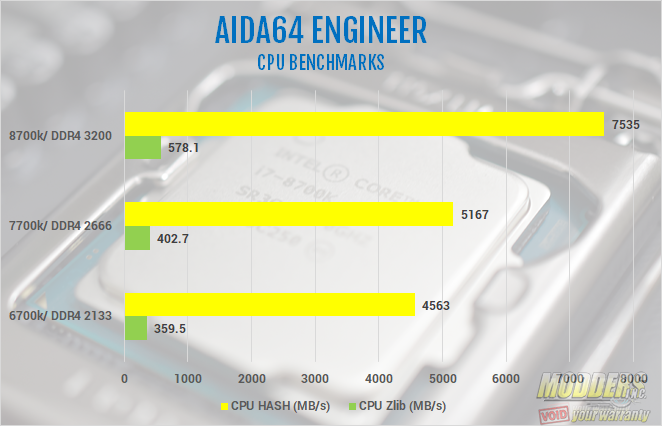
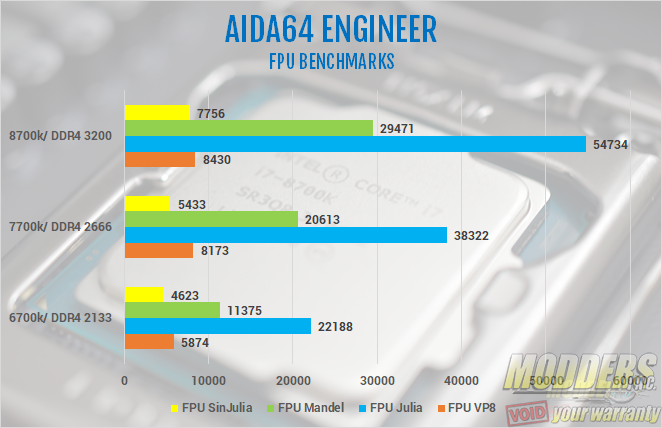
AIDA64 implements a set of 64-bit benchmarks to measure how fast the computer performs various data processing tasks and mathematical calculations. Multi-threaded memory and cache benchmarks are available to analyze system RAM bandwidth and latency. Benchmark pages of AIDA64 Extreme provide several methods to measure system performance. These benchmarks are synthetic, so their results show only the theoretical maximum performance of the system. The AIDA64 suite has various benchmarks for CPU, FPU, GPU, storage and memory testing.
CPU Queen is an integer benchmark that tests branch prediction and misprediction penalties. CPU PhotoWorxx tests the SIMD integer arithmetic execution units of the CPU and the memory subsystem. CPU ZLib is a compression benchmark that tests the combined CPU and memory performance. CPU AES is a multi-core encryption benchmark that uses Advanced Encryption Standard data encryption. CPU Hash is an integer benchmark that measures performance using SHA1 hashing algorithm. FPU Julia measures single precision FP, FPU Mandel measures double precision FP, FPU Sin Julia measures extended precision FP while FPU VP8 is a video compression test utilizing the FPU Julia fractal module. A quick side note, each processor was tested with different memory, running at different speeds. The charts are not meant as an apple to apples comparison. Each system was completely different. The 7700k and 6700k results are just there to compare the 8700k number to.
Cinebench R15
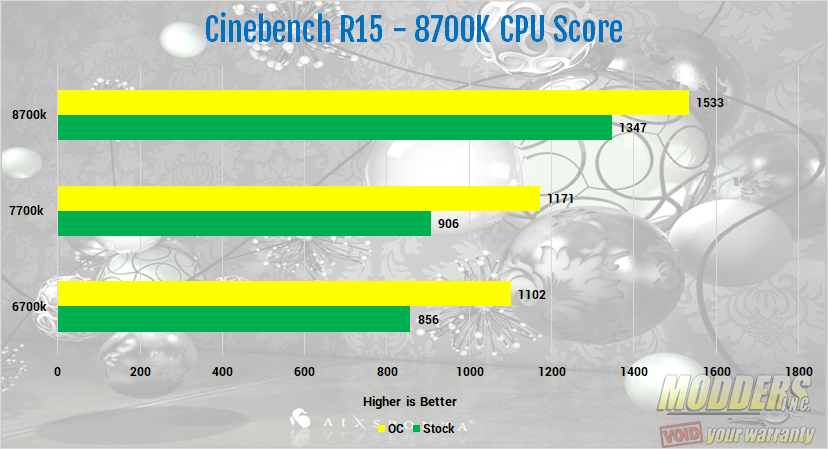
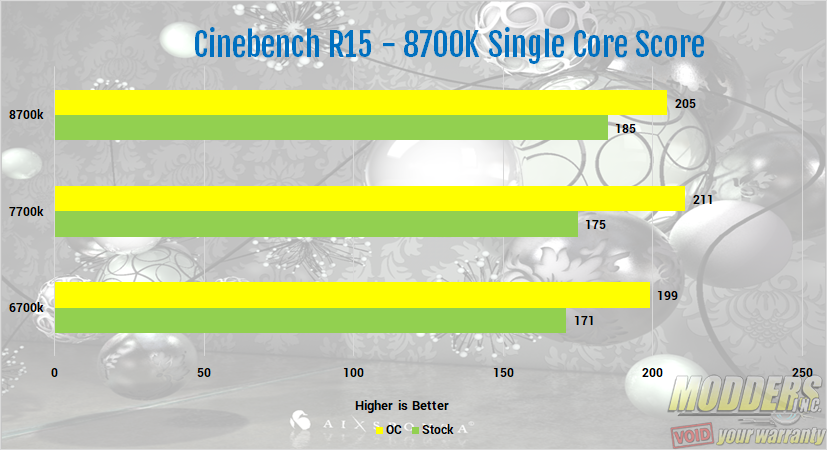
Based on MAXON’s award-winning animation software Cinema 4D, CINEBENCH is a real-world cross platform test suite that evaluates your computer’s performance capabilities. It has both the single thread and full performance test for your CPU, as well as an Open-GL test for your GPU. Cinebench R15 is one of the most widely used benchmarks used to test the performance. It puts the CPU under 100% load, but only for a very short time. Its gives a good baseline for your CPU. However, I wouldn’t use it for testing the stability of an overclock. I ran Cinebench with the CPU at stock and overclocked to 4.8 GHz. The stock run gave me an overall score of 1347 cb with a single thread of 185 cb. When overclocked, the i7 8700K hit 1533 cb with a single core score of 205. The charts give a direct comparison to the 6700k and the 7700k. Here, you can see that there was a much bigger jump in performance going from the 7700k to the 8700k than there was going from the 6700k to the 7700k. This was in part due to the two additional cores and 4 additional threads.
Memory Testing
Memory Testing (AIDA64)
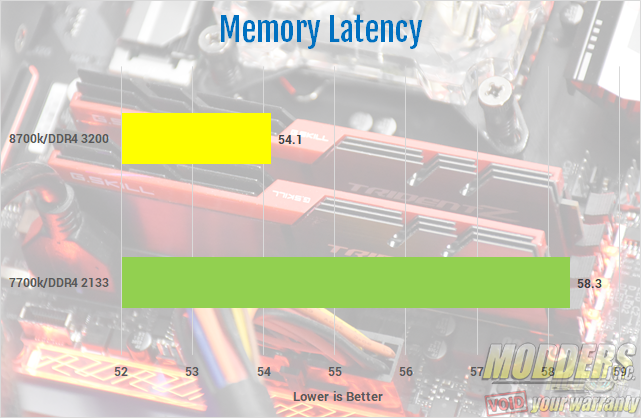
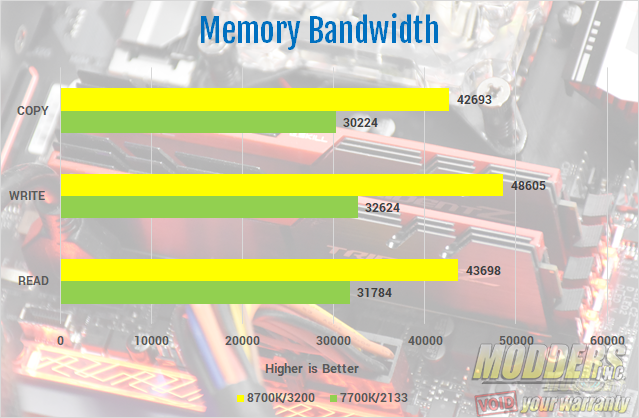
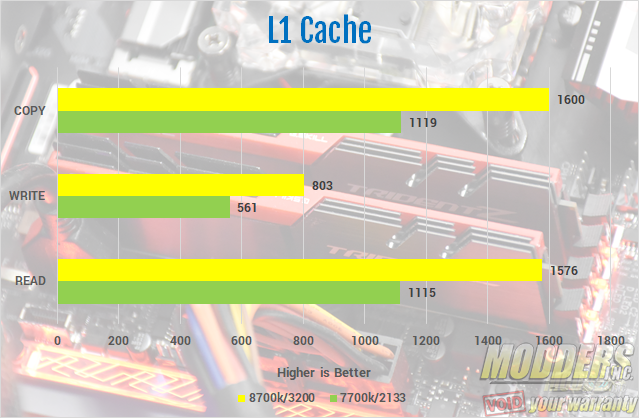
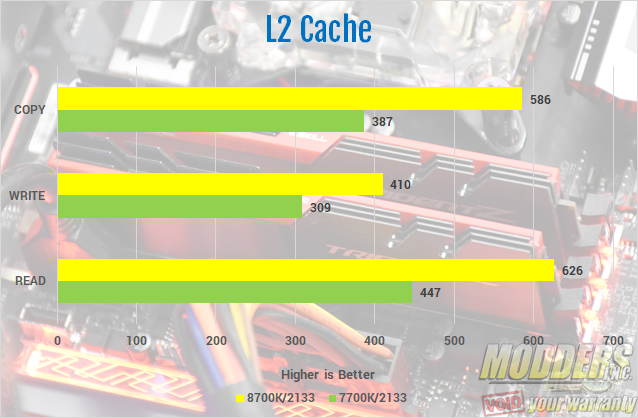
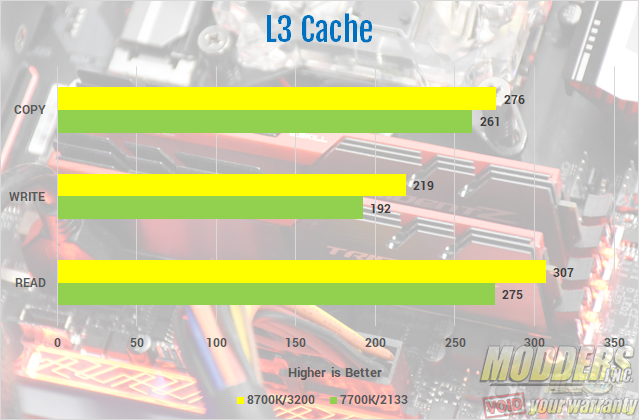
To test the memory on my test bench, I used the AIDA64 Cache and Memory Benchmark. The memory I used for testing is a 32 GB, 2 x 16 kit of G. Skill Trident Z 3200 MHz, CAS 14. It has been by far the best, and most stable memory I’ve personally ever used. The first part of the AIDA64 memory test is the latency test. The latency is measured in nanoseconds. With X.M.P profile #1 enabled, and the memory running at 3200 MHz, the latency was 54.1 nanoseconds. On the memory bandwidth test, the Trident Z kit I used scored 43698 on the read, 48605 on the write and 42693 on the copy. The L1, L2 and L3 cache bandwidth is measured in MB/s, or megabytes per second.
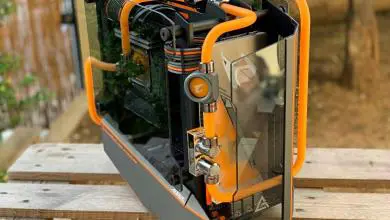
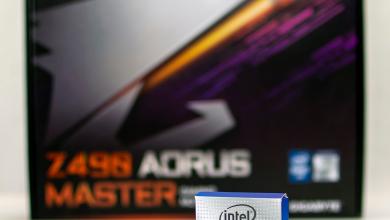

Right now I am running a I7-3770k 3.5Ghz Quad core that has been absolutely phenomenal since Q3 2012 when I built my computer.
I am starting to see the sunset though on it’s ability to max out settings and keep the frame rates where I like them even paired to a 1060 GTX GPU.
As soon as these intel back doors that hackers are using right now are closed in this line of CPU officially…then I will probably upgrade to this cpu.
….not until then though.