Synthetic Benchmarks
3DMARK
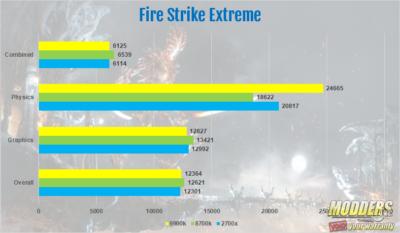
3DMark is a computer benchmarking tool created and developed by Futuremark used to determine the performance of a computer’s 3D graphic rendering and CPU workload processing capabilities. It does this through a series of graphics and physics and or CPU tests. I used 3DMarks most popular benchmark, Firestrike as well as their newest DX12 benchmark, Time Spy to test both the MSI Gaming X Trio 2080 and the Nvidia RTX Founders Edition 2080.
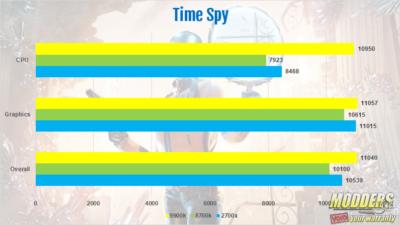
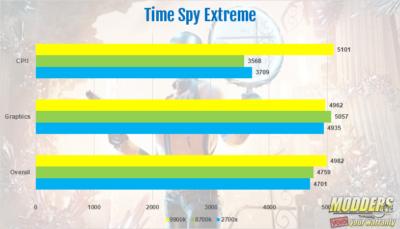
The over all scores in Time Spy were close. But the 9900k did best with an overall score of 11040, graphics score of 11057 and a CPU score of 10950. The 2700x was next with an overall score of 10539, graphics score of 11015 and a CPU score of 8468. Last was the 8700k with an overall score of 10100, graphics score of 10615 and a CPU score of 7923. In Time Spy Extreme the 9900k did best with an overall score of 4982, graphics score of 4962 and a CPU score of 5101. The 8700k was next with an overall score of 4759, graphics score of 5057 and a CPU score of 3568. The 2700x did have a higher CPU score than the 8700k with a score of 3709. But the graphic score was lowest at 4935 and the overall score was 4701.
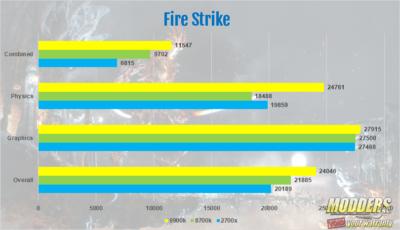
In Firestrike, the combination of the i9 9900k and the RTX 2080 gave me my best score ever. The overall score in Firestrike was24046. The Graphics score was 27915, the physics as 24761 and the combined was 11547. Next was the 87ook with the same MSI Gaming X Trio that was used with the 9900k. The overall score for the 8700k was 21885. The graphics was 27500. The physics was the lowest of the three at 18488 and the combined score was 9702. The overall score for the2700x was 20189. The graphics score was 27468. the physics was the second highest at 19859 and the combines score was 6815. I was very impressed with the overall performance of the 9900k with the RTX 2080.
Performance Test 9
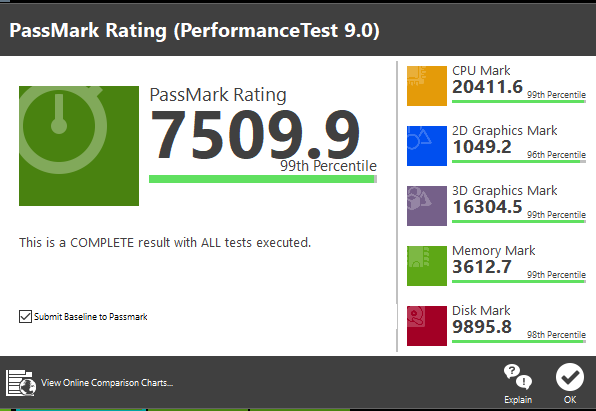
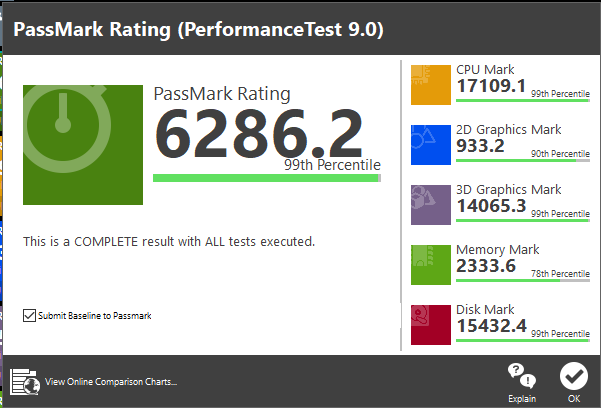
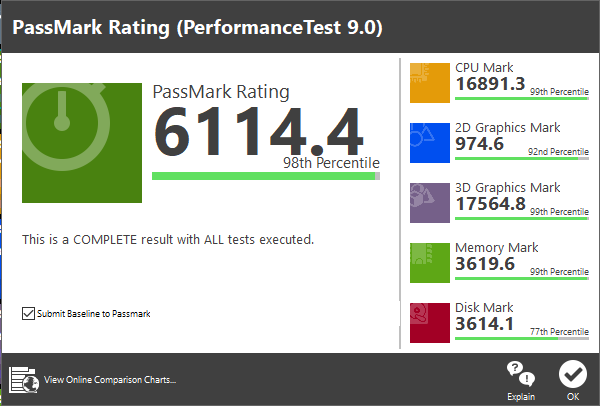
Performance Test 9 is a complete system benchmark that tests every main component of your system. The area’s tested are the Disk, Memory, 2D Graphics, 3D Graphics and CPU. There is also an overall PassMark Rating. Since this test is broken down into six parts, we’ll look at each test separate starting with CPU Mark. The i9 9900k came out on top in CPU mark with 20411.6. Next was the 2700x with 17109.1and last was the 8700k with 16891.3. Next was the 2D Graphics test. The 9900k scored best with 1049.2 followed by the 8700k with 974.6 and last was the 2700x with 933.2. Next up was 3D Graphics. The 8700k did best on this test with 17564.8 followed by the 9900k with 16304.5. The 2700x came in last in the 3D Graphics test with a score of 14065.3. In Memory Mark, the 9900k and 8700k were neck and neck. However, the 8700k came out the winner with a score of 6319.6, just beating out the 9900k with 3612.7. The 2700x ended up with a score of 2333.6. The last test in Passmark is the Disk Mark test. The 2700x was the clear winner with 15432.4 followed by the 9900k with 9895.8 and lst was the 8700k with 3614.1. However there is a reason for this. The 2700x has a 960 EVO as the boot drive. The 9900k also has an NVME drive. However its running a 512 GB Intel 660p that has a read and write speed of 1800 on the read and 1000 on the write. Much slower than the Samsung 960 EVO. The 8700k has a SATA based SanDisk ssd as the boot drive. The 9900k ended up with PassMark rating of 7509.9 and landed in the 99th percentile. Next was the 2700x with a PassMark rating of 6286.2 and the 8700k came in last with a PassMark rating of 6114.4



x264 FHD Benchmark 1.0.1 and x264 HD Benchmark 5.0.1 both are now ancient though.