Testing and Performance
AIDA64 ENGINEER
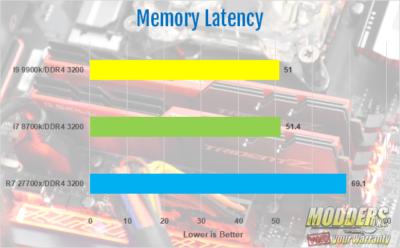
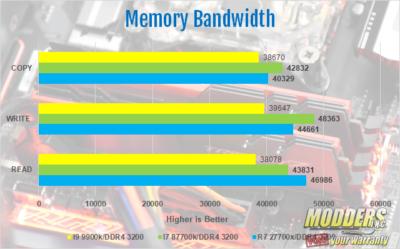
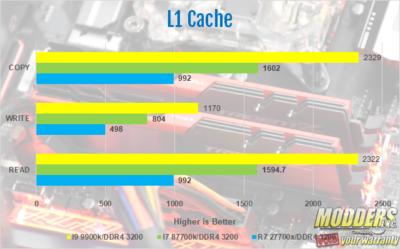
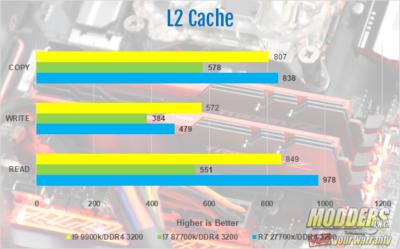
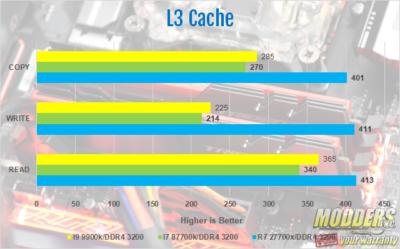
AIDA64 has a set of several 64-bit benchmarks to measure how fast the computer performs various data processing tasks and mathematical calculations. Multi-threaded memory and cache benchmarks are available to analyze system RAM bandwidth and latency. Benchmark pages of AIDA64 Extreme provide several methods to measure system performance. These benchmarks are synthetic, so their results show only the theoretical maximum performance of the system. The AIDA64 suite has various benchmarks for CPU, FPU, GPU, storage and memory testing.
Memory Testing
CPU Testing
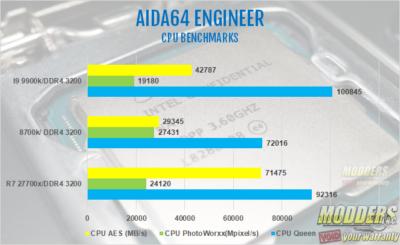
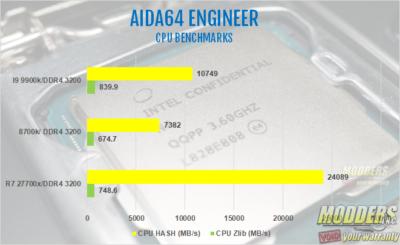
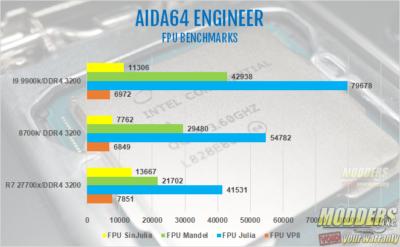
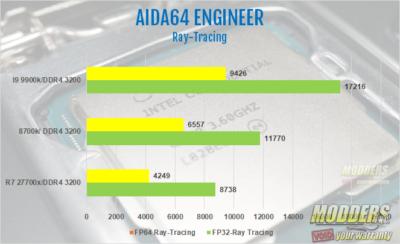
CPU Queen is an integer benchmark that tests branch prediction and misprediction penalties. CPU PhotoWorxx tests the SIMD integer arithmetic execution units of the CPU and the memory subsystem. CPU ZLib is a compression benchmark that tests the combined CPU and memory performance. CPU AES is a multi-core encryption benchmark that uses Advanced Encryption Standard data encryption. CPU Hash is an integer benchmark that measures performance using SHA1 hashing algorithm. FPU Julia measures single precision FP, FPU Mandel measures double precision FP, FPU Sin Julia measures extended precision FP while FPU VP8 is a video compression test utilizing the FPU Julia fractal module. A quick side note, each processor was tested with different memory, running at different speeds. Since each system was different, it’s not a side by side comparison. Ray-Tracing isn’t a test we usually run. However, with Ray-Tracing being big in tech news lately, or the lack of ray-tracing I should say, I decided to run these benchmarks. Both benchmarks measure the single and double precision floating-point performance through the computation of a scene with a SIMD-enhanced ray tracing engine. We ran both the FP-32 and FP-64 ray-tracing benchmarks in the AIDA64 suite. The I9 9900k did best on both FP-32 and FP-64. In F3-32 the 9900k scored 9426 and 17216 in the FP-64 benchmark. Next was the I7 8700k with scores of 6557 in FP-32 and 11770 in FP-64. Last was the R7 2700x with scores of 4249 in FP-32 and 8738 in FP-64. I wasn’t surprised the 9900k did best, or even that the 2700x came in last of the three. I was surprised at how big the gap was between the 9900k and the 2700x.
In the memory, CPU and FPU testing there really was no clear winner.Each chip came out on top of at least one test or more. . In CPU Queen, the 9900k came out on top with a score of 100845. Photoworx was the 8700k with the highest score of 27431. The 2700x did best in CPU Hash with 24089, more than double the score of the 9900k with 10749 and more than three times the score of the 8700k with 7382. In the FPU tests, the 9900k did best on Julia and Mandel with scored of 78678 on Julia and 42938 on Mandel. The 2700x did best on SinJulia with a score of 13667 and VP8 with a score of 7851.
Cinebench R15
Based on MAXON’s award-winning animation software Cinema 4D, CINEBENCH is a real-world cross platform test suite that evaluates your computer’s performance capabilities. It has both the single thread and full performance test for your CPU, as well as an Open-GL test for your GPU. Cinebench R15 is one of the most widely used benchmarks used to test the performance. It puts the CPU under 100% load, but only for a very short time. It gives a good baseline for your CPU. However, I wouldn’t use it for testing the stability of an overclock.
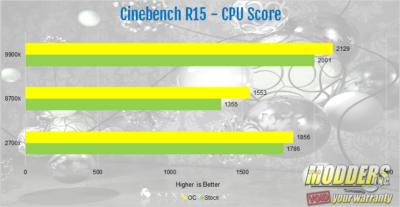
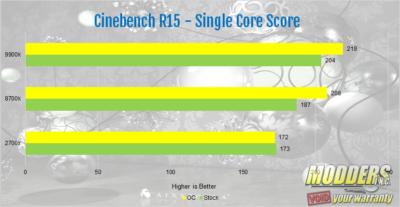
All three processors did well in Cinebench R15. To no surprise, the 9900k did best with a multi-threaded score 2001 CB and a single core score of 204. With the 9900k overclocked to 5.0 GHz, it achieved a score of 2129 CB and a single core score of 219 CB. The 9900k sports the highest scores for any chip I’ve personally ever tested. Next was the R7 2700x with a multi-threaded score of 1786 and a single core score of 173 at its stock speed of 3.7 GHz. With the 2700x over clocked to 4.150 GHz, it achieved a multi-threaded score of 1856 and the single core score went down to 172. I did test the single threaded score several time. This was the best result while overclocked. The 8700k did very well, when compared to other hex-core processors released by Intel in the past. For example, the best score I ever got with my old 5930k was 1332 overclocked to 4.6 GHz. The 8700k beat that at stock with a score of 1356 and a single core score of 187. Overclocked, it did very well with a multi-threaded score of 1555 and a single core score of 208. The 9900k was the clear winner in Cinebench R15.


x264 FHD Benchmark 1.0.1 and x264 HD Benchmark 5.0.1 both are now ancient though.