Test System and Benchmarks
Intel Core i5-10600k Test Bench
| Component |
Product Name | Provided By |
| Processor | Intel Core i5-10600k | Intel |
| Motherboard | Aorus Z490 Master | Gigabyte |
| Memory | G.Skill Trident Royal F4-3600C16D-16GTRG 16-16-16-36 (XMP) | G.Skill |
| Drive | Samsung 240 EVO 256GB SSD, Crucial MX500 1 TB SATA III SSD | Samsung/Crucial |
| Video Cards | Nvidia GeForce RTX 2080 Super Founders Edition | Nvidia |
| Monitor | BenQ EL2870U 28 inch 4K HDR Gaming Monitor 3840×2160 @ 60 Hz | |
| Case | DimasTech EasyXL | DimasTech |
| Power Supply | Cooler Master Silent Pro M2 1500W | Cooler Master |
| Operating System | Windows 10 1909 x64 Pro with latest patches and updates |
AMD Ryzen 9 3900x/Ryzen 7 3700x Test Bench
| Component |
Product Name | Provided By |
| Processor | AMD Ryzen 9 3600x/ AMD Ryzen 7 3600 | AMD |
| Motherboard | Aorus X570 Master | Gigabyte |
| Memory | G.Skill Trident Royal F4-3600C16D-16GTRG 16-16-16-36 (XMP) | G.Skill |
| Drive | Samsung 240 EVO 256GB SSD, Crucial MX500 1 TB SATA III SSD | Samsung/Crucial |
| Video Cards | Nvidia GeForce RTX 2080 Super Founders Edition | Nvidia |
| Monitor | BenQ EL2870U 28 inch 4K HDR Gaming Monitor 3840×2160 @ 60 Hz | |
| Case | DimasTech EasyXL | DimasTech |
| Power Supply | Cooler Master Silent Pro M2 1500W | Cooler Master |
| Operating System | Windows 10 1909 x64 Pro with latest patches and updates |
Intel Core i7-8700k/Core i9-9900k Test Bench
| Component |
Product Name | Provided By |
| Processor | Intel Core i7-8700K (Retail) | Intel |
| Motherboard | Aorus Z390 Pro | Gigabyte |
| Memory | G.Skill Trident Royal F4-3600C16D-16GTRG 16-16-16-36 (XMP) | G.Skill |
| Drive | Samsung 240 EVO 256GB SSD, Crucial MX500 1 TB SATA III SSD | Samsung/Crucial |
| Video Cards | Nvidia GeForce RTX 2080 Super Founders Edition | Nvidia |
| Monitor | BenQ EL2870U 28 inch 4K HDR Gaming Monitor 3840×2160 @ 60 Hz | |
| Case | DimasTech EasyXL | DimasTech |
| Power Supply | Cooler Master Silent Pro M2 1500W | Cooler Master |
| Operating System | Windows 10 1909 x64 Pro with latest patches and updates |
System settings –
Windows was set to High Performance in the power management settings in Windows.
Motherboard settings for the non-overclocked tests were reset to factory defaults and only the XMP for the G.Skill RAM was enabled. Everything else in the BIOS was left at the factory defaults for the stock tests.
Cooling
All my test benches are fitted with a custom loop featuring an EKWB Coolstream PE 360 mm radiator, EKWB Vardar fans x3, EKWB Velocity waterblock for both Intel and AMD, as well as an EKWB XRES 140 REVO D5 filled with distilled water. The motherboard settings were left to their stock configurations.
Let the battle of the 6-core CPUs begin!
Testing and Performance
AIDA64 ENGINEER
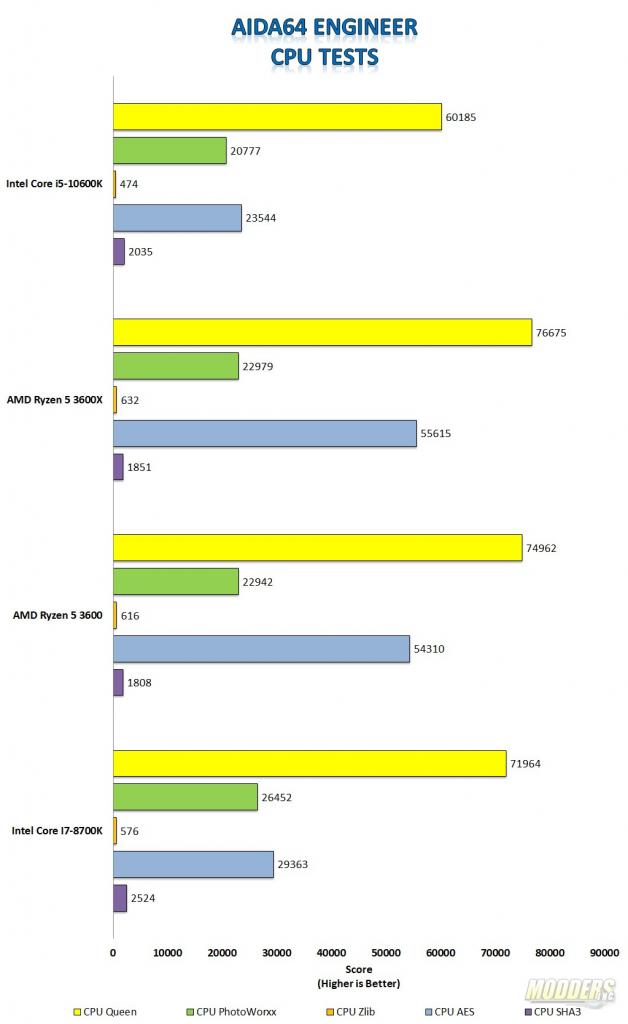
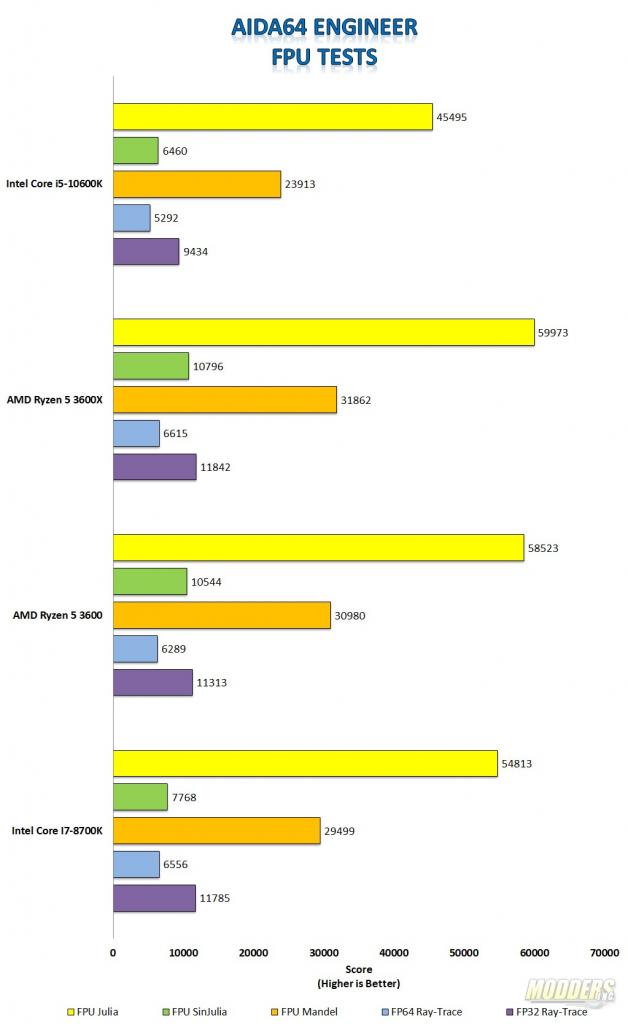
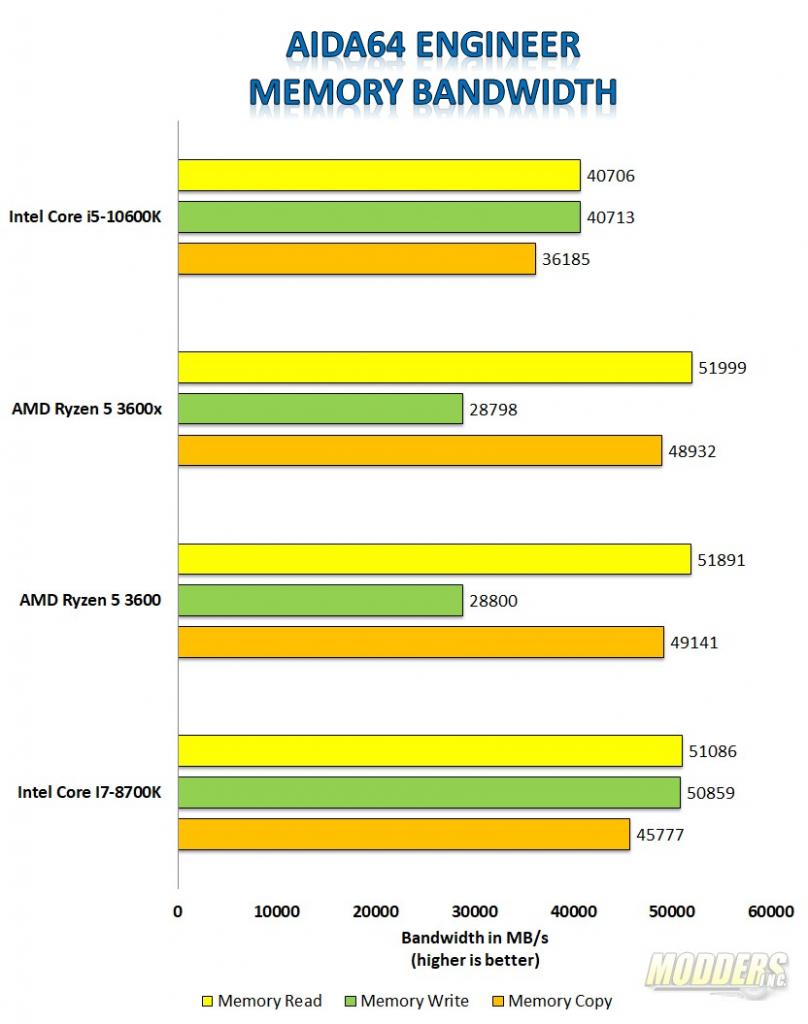
AIDA64 has a set of several 64-bit benchmarks to measure how fast the computer performs various data processing tasks and mathematical calculations. Multi-threaded memory and cache benchmarks are available to analyze system RAM bandwidth and latency. Benchmark pages of AIDA64 Extreme provide several methods to measure system performance. These benchmarks are synthetic, so their results show only the theoretical maximum performance of the system. The AIDA64 suite has various benchmarks for CPU, FPU, GPU, storage, and memory testing.
As you can see, the i5-10600k lags slightly behind the rest of the CPUs here. I wasn’t sure exactly why until a little later on in the testing process. When I run benchmarks, I run each test 3 times, then average the result together.
Here’s where I started to think the issue with performance between the CPU is caused. As you can see, the memory performance of the i5-10600 lags in the read and copy tests of all the CPUs even the older 8700k. The difference is not small either. When I first started putting the results together, I went back and re-tested. I also check to make sure I was in Dual Channel mode. Finally, I tested the memory on another test bench and the memory results on that PC were as expected.
Intel Core i5-10600k Benchmarks Continued
Cinebench R20
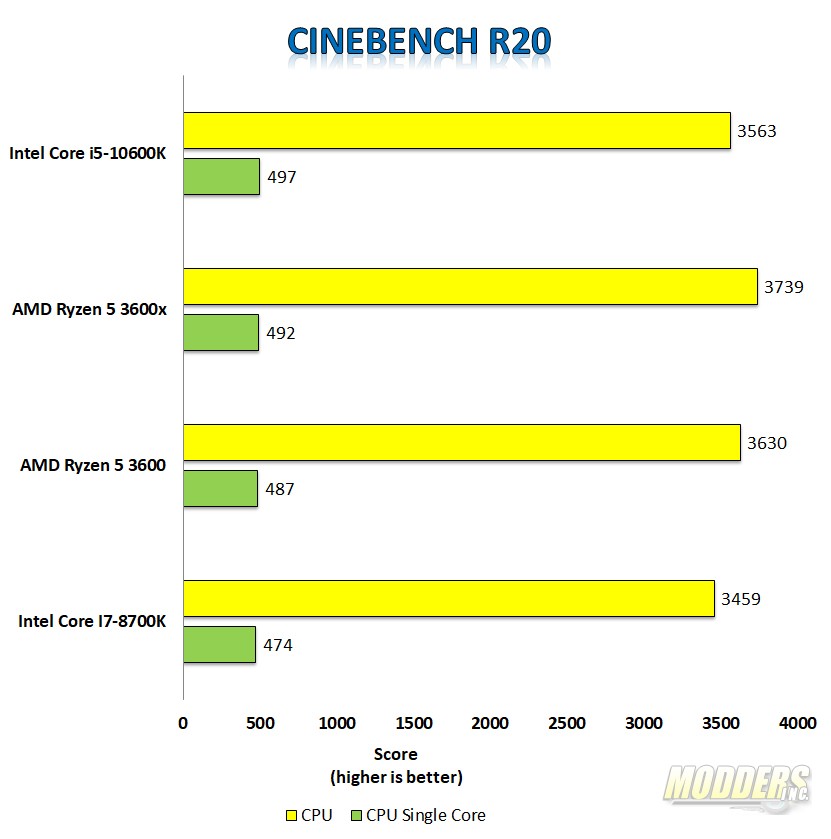
Cinebench is a real-world cross-platform test suite that evaluates your computer’s hardware capabilities. Improvements to Cinebench Release 20 reflect the overall advancements to CPU and rendering technology in recent years, providing a more accurate measurement of Cinema 4D’s ability to take advantage of multiple CPU cores and modern processor features available to the average user.
In Cinebench, the Core i5-10600k performs well against the other 6-core CPUs. The multi-core test shows it lagging ever so slightly behind the AMD CPUs and pretty much on equal footing with the older 8700k.
POV-Ray 3.7
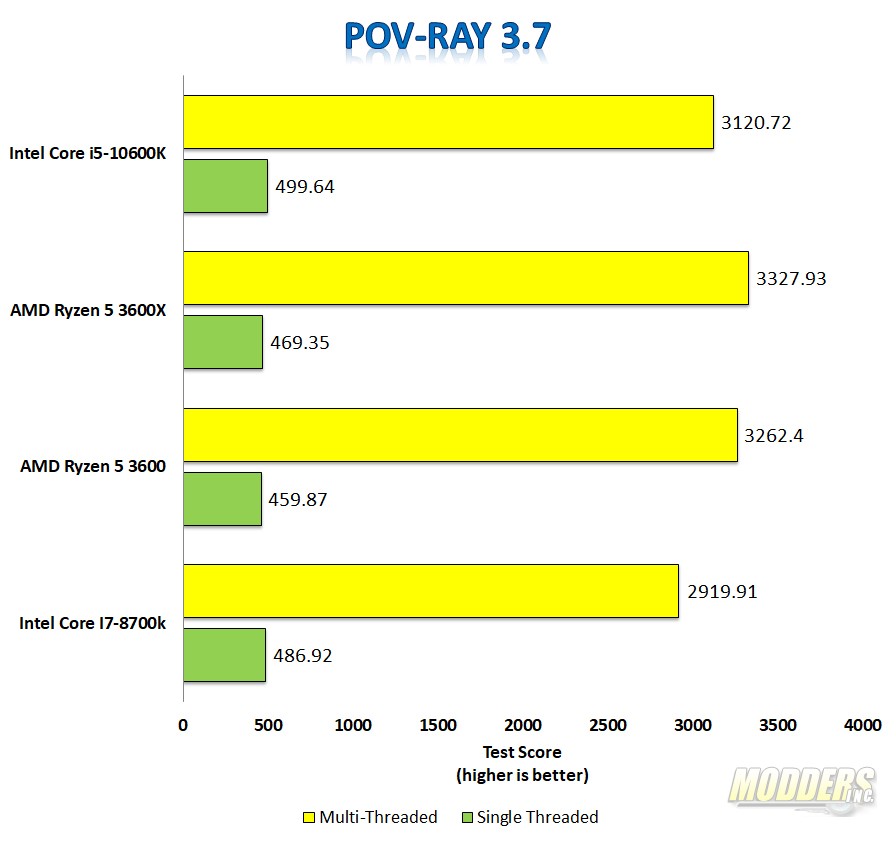
The Persistence of Vision Ray Tracer, or POV-Ray, is a ray-tracing program that generates images from a text-based scene description and is available for a variety of computer platforms. It was originally based on DKBTrace, written by David Kirk Buck and Aaron A. Collins for the Amiga computers. There are also influences from the earlier Polyray[6] raytracer contributed by its author Alexander Enzmann. POV-Ray is free and open-source software with the source code available under the AGPLv3.
POV-Ray shows that AMD is slightly better when it comes to multi-core rendering whereas Intel’s i5-10600k edges out the rest in the single-core test.
