Testing and Performance
AIDA64 ENGINEER
AIDA64 has a set of several 64-bit benchmarks to measure how fast the computer performs various data processing tasks and mathematical calculations. Multi-threaded memory and cache benchmarks are available to analyze system RAM bandwidth and latency. Benchmark pages of AIDA64 Extreme provide several methods to measure system performance. These benchmarks are synthetic, so their results show only the theoretical maximum performance of the system. The AIDA64 suite has various benchmarks for CPU, FPU, GPU, storage and memory testing.
Memory Testing
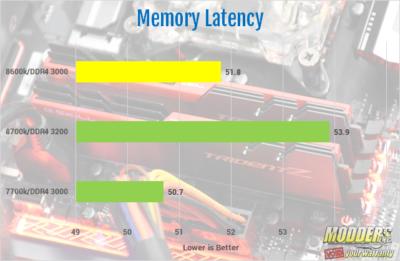
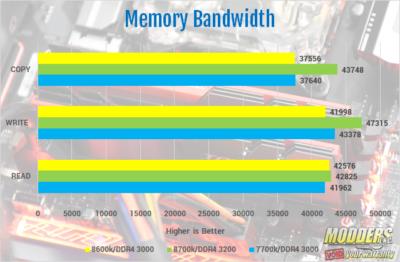
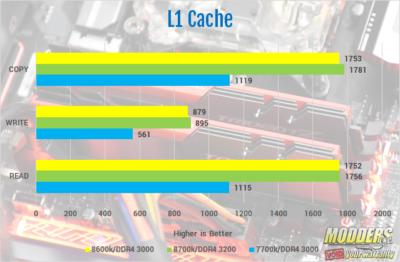
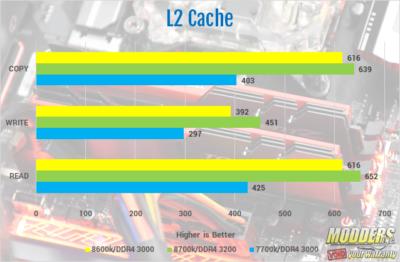
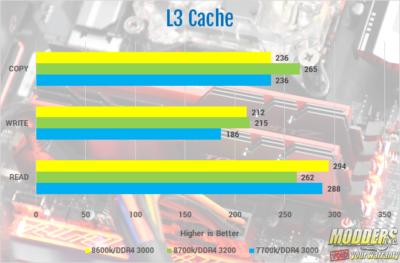
The memory I used for testing is a 16 GB, 2 x 8 kit of HyperX Predator 3000 MHz, CAS 15. The first part of the AIDA64 memory test is the latency test. The latency is measured in nanoseconds. With X.M.P profile #1 enabled, I had several issues. The least of which was my CPU phantom throttling. However, with XMP Profile #2 enabled, the system runs great. So, with XMP profile 2 set and the memory running at 3000 MHz, the latency was 51.8 nanoseconds. On the memory bandwidth test, the HyperX Predator kit I used scored 42576 on the read, 41998 on the write and 37556 on the copy. For the L1, L2 and L3 cache, the read, write and copy are on the charts below.
CPU Testing
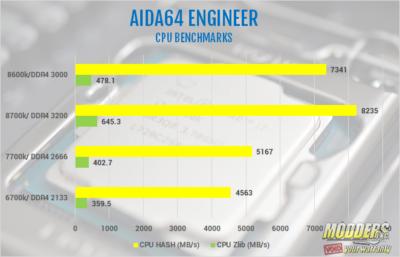
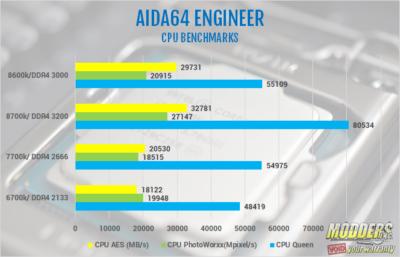
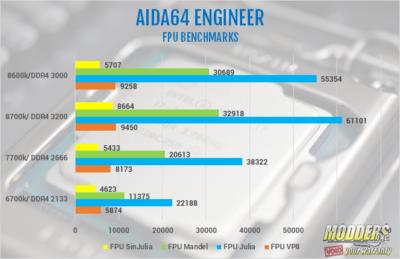
CPU Queen is an integer benchmark that tests branch prediction and misprediction penalties. CPU PhotoWorxx tests the SIMD integer arithmetic execution units of the CPU and the memory subsystem. CPU ZLib is a compression benchmark that tests the combined CPU and memory performance. CPU AES is a multi-core encryption benchmark that uses Advanced Encryption Standard data encryption. CPU Hash is an integer benchmark that measures performance using the SHA1 hashing algorithm. FPU Julia measures single precision FP, FPU Mandel measures double precision FP, FPU Sin Julia measures extended precision FP while FPU VP8 is a video compression test utilizing the FPU Julia fractal module. A quick side note, each processor was tested with different memory, running at different speeds. Since each system was different, it’s not a side by side comparison. As the charts show, the 8600k wasn’t too far behind the 8700k in the Aida64 CPU and FPU benchmarks. In addition, the 8600k was well ahead of both the 6700k and 7700k. Keep in mind, all four processors were on different chipsets and ran different memory.
Cinebench R15
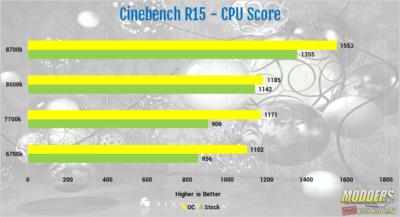
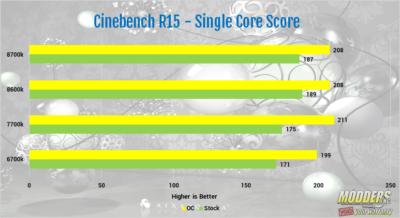
Based on MAXON’s award-winning animation software Cinema 4D, CINEBENCH is a real-world cross platform test suite that evaluates your computer’s performance capabilities. It has both the single thread and full performance test for your CPU, as well as an Open-GL test for your GPU. Cinebench R15 is one of the most widely used benchmarks used to test the performance. It puts the CPU under 100% load, but only for a very short time. It gives a good baseline for your CPU. However, I wouldn’t use it for testing the stability of an overclock. I ran Cinebench with the 8600k at stock and overclocked to 4.8 GHz. The chart shows side by side comparisons of the last 3 generations i7, the 6700k, 7700k and 8700k.
The stock run gave me an overall score of 1042 CB with a single thread of 189 CB. This is only 213 CB lower than my 8700k results, and 2 CB higher on the single core. When overclocked, the 8600k hit 1185 CB with a single core score of 208. Both the 8700k and 8600k I have are retail samples. They both achieved the same single-core score of 208 CB while overclocked to 4.8 GHz. The overall score of the 8600k was impressive. Especially considering the best score I ever got on my confidential 7700k was 1171.
Multimedia, Compression and Semi-Synthetic Benchmarks
X264 FHD
x264 is a free software library for encoding video streams into the H.264/MPEG-4 AVC format. x264 FHD measures how efficient a system is in encoding H.264 video and produces results in frames-per-second. H.265/HEVC video encoding is the future of video able to compress significantly larger resolution videos including 4K and make streaming a possibility. The 8600k ran the x264 FHD benchmark at an average of 37.88 frames per second.
X265
x265 is an open-source implementation of the H.265 standard and x.265 HD benchmark tests the CPU’s ability to process an HEVC video. This benchmark is run by the processor alone. With its additional 2 cores, the 800k averaged 25.78 FPS. This was less than 2 fps behind the i7 8700k.For comparison, I’ve added results from previous generations. As you can see, the 8600k is well ahead of the 7700k and 6700k.
7-Zip
The 7-zip benchmark shows a rating of MIPS (million instructions per second). The rating value is calculated from the measured speed, and it is normalized with results of Intel Core 2 CPU with multi-threading option switched off. So, if you have modern CPU from Intel or AMD, rating values in single-thread mode must be close to real CPU frequency. There are two tests, compression with LZMA method and decompression with LZMA method. Once the total passes reach 100, the score is taken. 7-Zip gives the resulting score for decompressing, compressing and an overall score. The Decompressing score for the 8600k was 28910 MIPS or Million Instructions per Second. The Compression score was 32873 MIPS and the overall score was 30891 MIPS. For comparison, I’ve included a chart with 7-Zip overall results for the 8700k and 7700k. It’s no surprise that the 8600k falls behind the 8700k. However, the bigger surprise is that the 8600k is ahead of the 7700k, even if not by that much.
WINRAR
WinRAR is a file archiver utility for Windows, developed by Eugene Roshal of win.rar GmbH. It can create and view archives in RAR or ZIP file formats and unpack numerous archive file formats. The chart shows a generational increase from the 6700k to the 7700k and the 8700k is the fastest at 19270 KB/s. The overall results for the 8600k were 10716 KB/s. The chart shows that Winrar does better with more threads, as opposed to straight cores.
Handbrake
HandBrake is a free and open-source video transcoder, originally developed in 2003 by Eric Petit to make ripping a film from a DVD to a data storage device easier. Essentially, it can convert video to almost any modern format. HandBrake is available for Linux, macOS, and Windows. The workload video file is a ~6.27 GB, 3840 x 1714, 73.4 Mbps, 24fps, H.264, .mov video file that is transcoded to a ~1480 MB, 1920×858, ~17.1 Mbps, 24fps, H.264, .mp4 video file. The 8600k encoded the file in 4 minutes and 42 seconds. Only faster than the I7 4790k. However, only 34 seconds slower than the 8700k. Considering the 8600k has an additional 6 threads, that’s not bad. When compared to the i5 6600k, the 8600k was 31 seconds faster. All benchmarks were run with the same settings, but not necessarily the same hardware.
Sub System Benchmarks (Storage, Audio, and Networking)
Storage Benchmarks
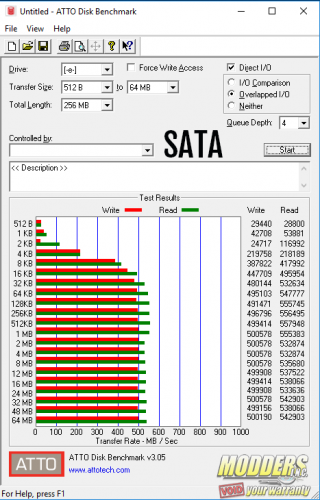
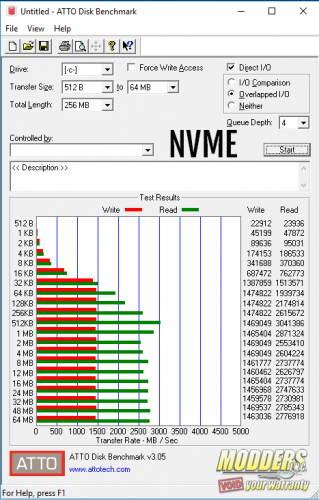
For Storage benchmarks, I used 3 different benchmarks. The first being PCMark 8, another Futuremark program. Next, ATTO Disk Benchmark and finally, CrystalDiskMark5. ATTO and CrystalDisk Mark were used to test the 1 TB 850 Evo, a SATA drive, and a 250 GB 960 EVO, an NVME Drive. PCMARK 8 was only tested on the 850 EVO, and I also ran the conventional performance benchmarks as well.
PCMark 8
The PCMark 8 Storage benchmark is used to test the performance of SSDs, HDDs and hybrid drives with traces recorded from Adobe Creative Suite, Microsoft Office and a selection of popular games. You can test any recognized storage device, including local and external drives. Unlike synthetic storage tests, the PCMark 8 Storage benchmark highlights real-world performance differences between storage devices. We ran all three of the conventional benchmarks PCMark 8 has to offer. These are Work, Creative and Home. From the results on the chart, you can see the 8600k is just slightly behind the 8700k, and just slightly ahead of the 7700k.
ATTO Disk Benchmark
The ATTO Disk Benchmark utility was designed to measure regular disk drive performance. However, its more than capable measuring both USB flash drive and SSD speeds as well. The utility measures disk performance rates for various sizes of files and displays the results in a bar chart showing read and write speeds at each file size. The results are displayed in megabytes per second.
In ATTO, the SanDisk SSD Plus did as expected, nearly saturation the SATA interface. The 850 EVO hit 558 MB/s on the read speeds and about 500 MB/s on the write speeds. On the 960 EVO, its hit 3041 MB/s and 1475MB/s on the write. The NVME results were a bit slower than I had expected from other motherboards I’ve tested the same drive on.
CrystalDiskMark
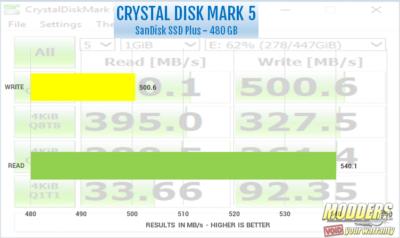
“CrystalDiskMark is designed to quickly test the performance of your hard drives. Currently, the program allows measuring sequential and random read/write speeds.” It’s one of the most commonly used utilities for testing drives.
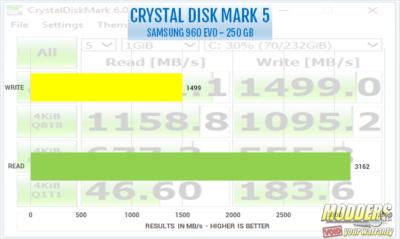
The results for CrystalDiskMark5 were very similar to the ATTO results. The SanDisk SSD Plus hit 540.1 MB/s on the read and 500.6 MB/s on the write. Almost identical to the ATTO results. On the NVME drive, the 960 EVO hit 3162 MB/s on the read and 1499 MB/s on the write. Very close, if not a bit faster than the ATTO results.
Audio Testing
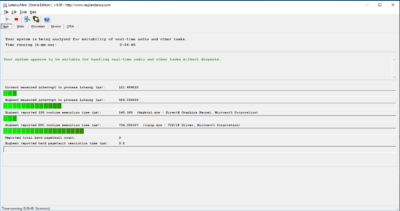
To test the onboard audio on the Z370N WIFI, we use the Rightmark Audio Analyzer benchmark. However, before we run the benchmark, we must test the DPC, or Deferred Procedure Call latency. The DPC is checked to ensure the audio can produce useable results in Rightmark. DPC, or Deferred Procedure Call latency, is a Windows function that handles driver efficiency and allows high-priority tasks to defer required, but lower-priority tasks for later execution. We use LatencyMon to test the DPC Latency.
I left LatencyMon run for a little over 25 minutes. The highest reported ISR routine execution time was 140.38. The highest reported DCP routine execution was 734.30. At the 4000 microseconds, the system will be unsuitable for real-time audio playback. Since both results were under this range, we can continue to Rightmark Audio Analyzer.
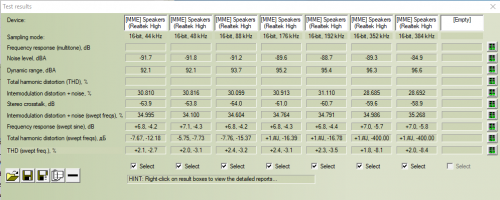
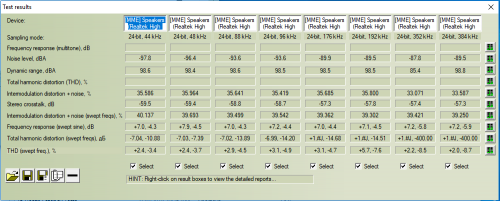
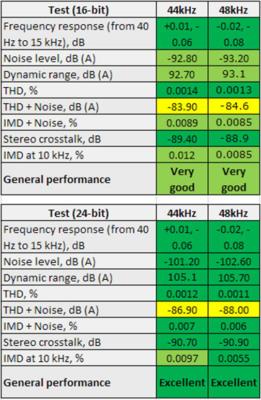
To test with Rightmark, you must first plug into both the rear headphone jack and the rear mic jack using a double-ended 3.5 mm jack cable. This creates an audio loop to test the internal audio performance of the onboard audio. We tested using both 16 and 24-bit settings through a range of frequencies from 44 kHz up to 192 kHz. The chart below is to give an idea of what good results for the Rightmark benchmark look like. When compared to the results for the Z370N WIFI, the results show the board to have very good onboard audio.
Network Testing
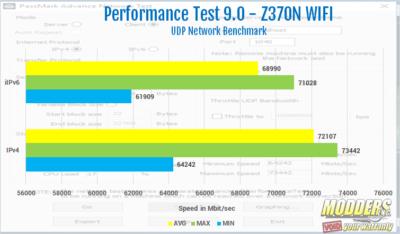
For network testing, I used my Comcast Business class router from Motorola. I used my test bench system as the server PC and the test system as the client. The Test system was used in our 8700k review, with one upgrade. The 1080 ti used previously has been replaced with a Quadro P5000. The system We use the Networking Test in the PassMark Performance Test 9. We tried to run both the TCP and UDP Networking tests. However, no matter what I did, the TCP test wouldn’t run. I tried 3 different server PCs. So, the results of this test are the UDP Networking test on both IPv4 and IPv6. Here are the results.
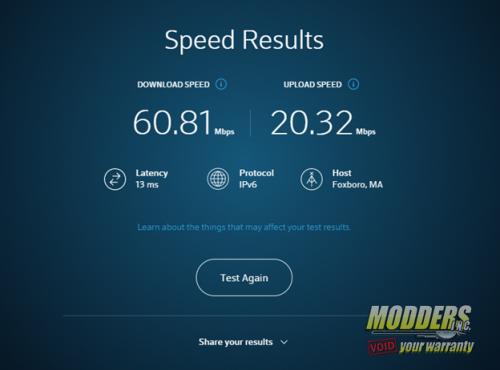
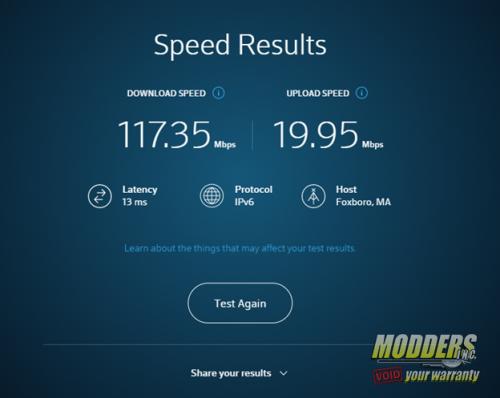
Since this motherboard has 802.11 WIFI, it wouldn’t be a full review if we didn’t run a speed check on the WIFI. My office has Comcast Business class internet. The plan is 100 Mbps download by 20 Mbps upload. The 802.11 ac WFIF on the Z370N WIFI hit 60.81 Mbps download and 20.32 Mbps upload. Through ethernet, the speeds test results were 117.35 Mbps download and 19.95 Mbps upload. The WIFI on this board is more than suitable for gaming, streaming, uploading to YouTube, really anything you need it to do.






Am I able to remove the WIreless AC card from this Gigabyte Z370n Wifi board to replace it with another module I’d like to upgrade to?
Tyler, yes you can. look at near the bottom of page 3. It shows it in the pictures. Also, thank you for reading our review.