Benchmarks
The ECS LIVA Z2 is not a performance powerhouse by any stretch of the imagination. By posting benchmark scores, we’re merely hoping to give you an idea of the practical limits of this low-power device. Establishing realistic boundaries is important, because frankly, the LIVA Z2 is so small and versatile that there really isn’t a whole lot of things it can’t do to some degree or another (well, you can forget about enthusiast computing loads). Pitting this system against even a low-end desktop processor doesn’t make sense, so we chose to set up an Acer Aspire One Cloudbook as the Z2’s rival, equipped with an Intel Celeron N3050 dual-core processor, 2GB of DDR3 DRAM, and 32GB of eMMC storage. You can probably guess which device is going to come out on top here.
Another thing I feel compelled to point out is something you’ll probably notice as you read on. That is that I’ve included a lot of CPU-centric benchmarks, and just a few that tax the other subsystems. That’s largely due to the fact that you can upgrade the storage device and memory. Even doubling the memory and using a cheap SATA SSD in the Z2’s internal 2.5-inch bay will make a dramatic difference in almost everything you do with this system. As such, we’re disinclined to knock the system for not knocking our socks off in the following tests, and you should be too. So without further ado…
SiSoft SANDRA
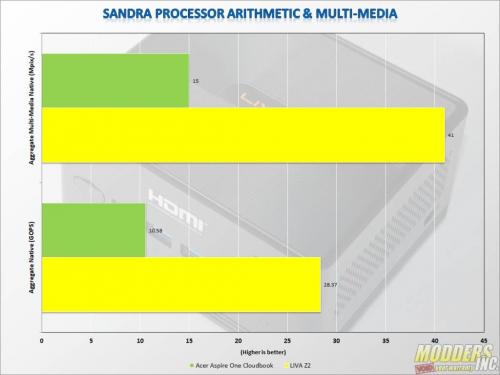
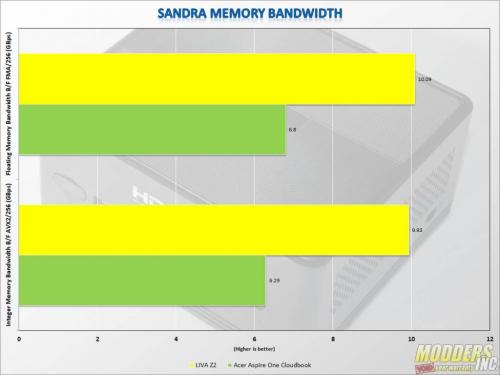
SiSoftware’s SANDRA suite offers a number of benchmarks designed to test the performance of various system components. For our purposes, we ran the Processor Arithmetic and Processor Multimedia tests and combined them into a single graph. The first test is designed to measure arithmetic performance or determine how good the processor is at churning out calculations. The Multimedia test scores the processor on how quickly it manages to generate a picture of the Mandelbrot fractal, using 255 iterations for each data pixel. Although we tend to lump SANDRA’s tests into the synthetic category, this test is a real-world application for putting the processor’s SIMD instructions to work. Note, the Processor Arithmetic aggregate scores are in GOPS (billions of operations per second) and the Processor Multimedia test results are in Megapixels per second. SANDRA’s Memory Bandwidth test is a fairly straightforward test that does what it says, reporting its results as Gigabytes per second (Gbps).
SANDRA is our first test, and it shows what a huge different twice as many threads and a higher core clock will do for you.
Aida64 Engineer
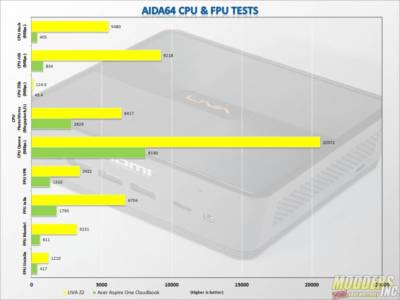
The AIDA64 suite has various benchmarks for CPU, FPU, and memory testing: CPU Queen is an integer benchmark that tests branch prediction and misprediction penalties. CPU PhotoWorxx tests the SIMD integer arithmetic execution units of the CPU and the memory subsystem. The CPU ZLib test is a compression benchmark that evaluates the combined CPU and memory performance. CPU AES is a multi-core encryption benchmark that uses Advanced Encryption Standard data encryption. The CPU Hash test is an integer benchmark that measures performance using the SHA1 hashing algorithm. There are four floating-point tests, including FPU Julia that measures single precision FP, FPU Mandel for measuring double precision FP, FPU SinJulia for measuring extended precision FP, and FPU VP8, which is a video compression test utilizing the FPU Julia fractal module.
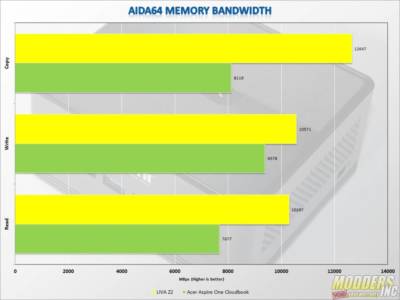
Using AIDA64, we can determine memory performance, as well as latency, read, write, and copy speeds.
CineBench R15
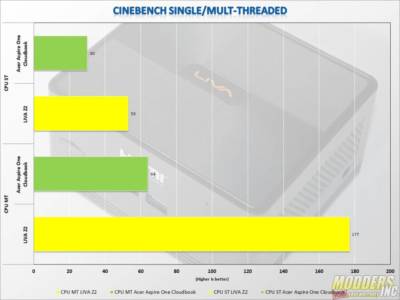
MAXON’s Cinebench R15 offers a processor test for the CPU and an OpenGL test for the GPU. We relied on the single-thread and multi-thread CPU-centric tests. Normally we rerun these tests with our overclocked settings, however, ECS did not build the LIVA Z2 to be overclocked. Considering the fact that we have no way to increase the cooling capacity of the black anodized lump of aluminum bolted onto the LIVA Z2’s motherboard, we decided to go easy.
POV-Ray 3.7
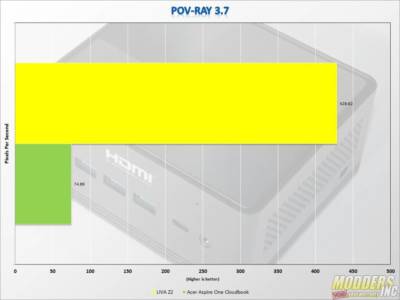
POV-Ray refers to the Persistence of Vision Ray Tracer, and it is designed to illustrate the CPU-crushing difficulty of ray-tracing. Yeah, we know graphics cards do that now. We also like to use POV-Ray to push the processor to its thermal and core-speed limits.
If you were wondering how long it took the Intel Celeron N3050 to perform this benchmark, I got almost all the way through a season two episode of Ozark. Thankfully, the LIVA Z2 performed the render in much shorter order.
3DMark Skydiver
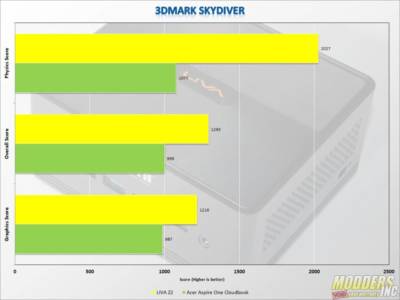
Futuremark’s 3DMark is a semi-synthetic gaming benchmark that calculates both graphics and CPU-bound physics in a controlled series of tests and provides scores that can be compared with other gaming platforms. Futuremark designed the Skydiver benchmark to stress medium-range laptops, with integrated graphics, rendering visuals at a resolution of 1,920 x 1,080. Even this lightweight benchmark shows that the LIVA Z2 is just not cut out for gaming.
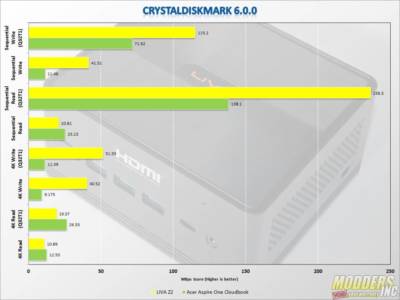
CrystalDiskMark 6.0.0
CrystalDiskMark is designed to asses the performance of your storage devices. The utility lets you measure sequential and random read/write speeds based on varying queue depths. It’s one of the most commonly used utilities for testing hard drives, SATA SSDs, NVMe SSDs, and other storage components.
