CRYORIG H7 CPU Cooler Review: Worry-free Compatibility
Test System and Benchmark Results
Test System:
| Processor | Intel Core i7-4770K (Retail) |
| Motherboard | ASUS Maximus VI Gene Z87 Motherboard (1603 BIOS) |
| Memory | Mushkin Stealth 1600MHz DDR3 |
| Drive | OCZ Agility 4 256GB SSD |
| Video Card | Intel Integrated Graphics |
| Thermal Compound | Noctua NT-H1 |
| Case | DimasTech Mini v1 |
| Power Supply | Corsair HX850W |
| Operating System | Windows 7 x64 Pro |
Test was conducted on a DimasTech MiniV1 open-air test-bench for parity performance between tower-style coolers and C-type downward or upward blowing coolers. Ambient temperature is measured at the fan intake and kept as constant as possible (room controlled temperature). All case and heat sink fans were benchmarked with fan control settings disabled and running at 100% unless otherwise specified.
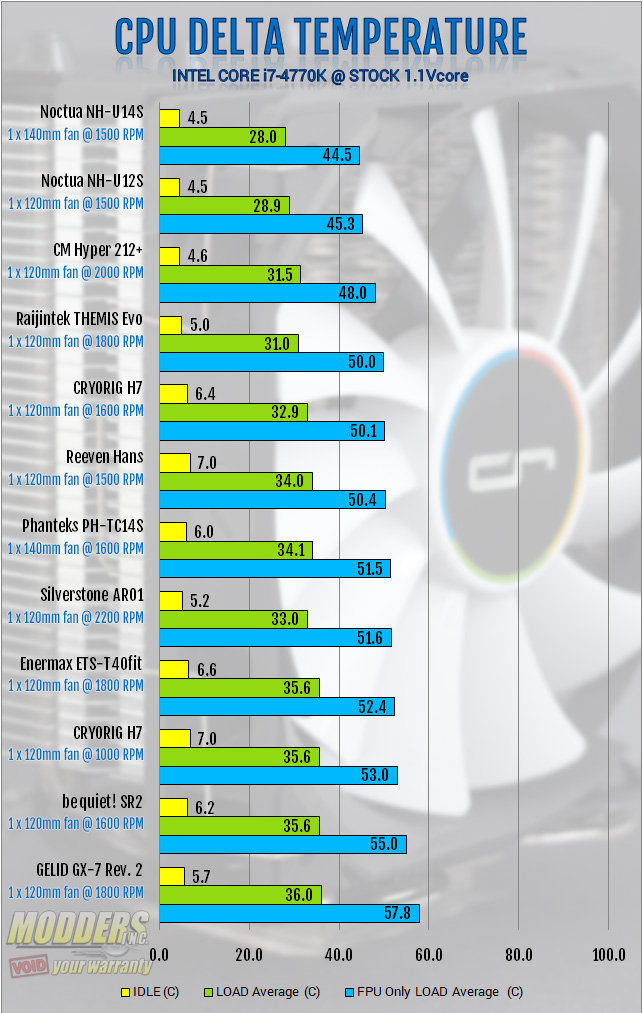
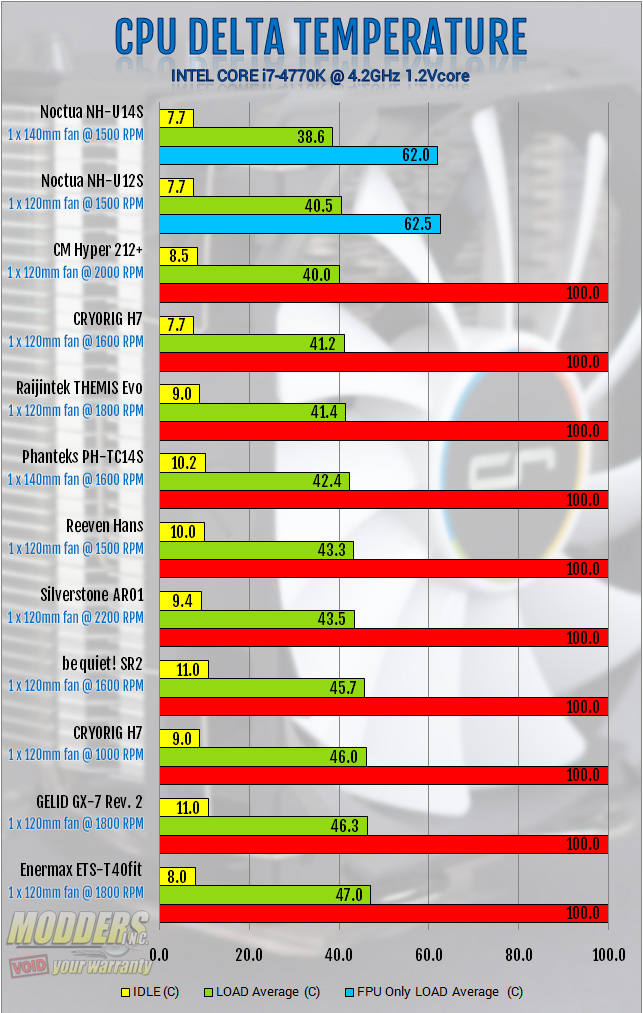
To get closer to real world performance, a retail Intel i7-4770K CPU was used (non-delidded). Stock settings use a constant 1.1Vcore voltage while overclock settings use a constant 1.2Vcore voltage with EIST disabled (1.28Vcore OC test added for high-end air coolers). The Intel core i7-4770K integrated graphics was used for display output and no discrete graphics card was installed to prevent additional heat sources from contributing inside and outside the case. Multi-core enhancement is enabled in the BIOS by default and left on (ASUS Turbo Core policy used instead of Intel standard). Note that performance results on this setup are not directly comparable with any benchmarks from some of the previous reviews as the UEFI BIOS on the motherboard has been updated and now has a much tighter control on the Vcore voltage.
Mushkin Stealth DDR3 modules ensure full compatibility with any CPU cooler tested as its heatspreaders only add ~1.5mm to the standard JEDEC module height of 30mm compared to other modules which limit cooler compatibility.
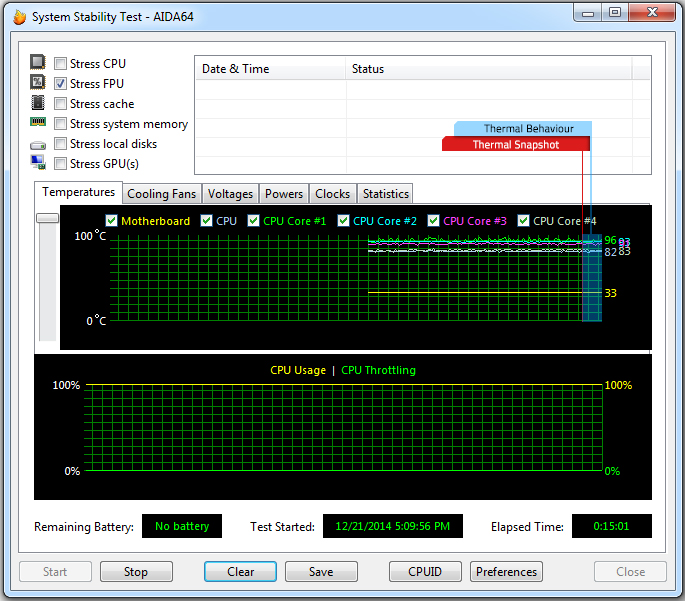
Temperatures are averaged (last minute) from individual core temperature results monitored by AIDA64 after 15 minutes using the default CPU, FPU, Memory and Cache simultaneous load. AIDA64 is able to use the latest instructions including AVX and AVX2, etc unlike other older CPU load tests so it is also a lot more “future proof” as more software start to utilize it. FPU-only load average is used to simulate worst case scenario load levels similar to Intel Burn Test or OCCT. Please keep in mind that this test is brutal and not even close to real-world load (especially not that constant for that amount of time), so not many CPU coolers are expected to pass this test but the ones that do are exceptional. Results marked “100″ and in red means thermal limit was reached and the CPU was throttled, even for just but a second. This includes results where even just the first core reached the limit and even if it briefly happened. It is marked as 100 in red in the review if it happens three times. Three runs are conducted per cooler and a fourth run is done after a remounting to verify. Last minute average is taken instead of peak because it represents the averaged behaviour of the thermal performance instead of worst-case scenario or a snapshot. Temperature delta results are used to account for variance since not all heatsinks can be conducted on the same day.
The Corsair HX850W power supply’s fans only ramp up when system load is past 20% making it an excellent power supply to use for when testing the CPU cooler’s noise levels. Any load under that and the fan does not spin at all, effectively acting in passive mode.
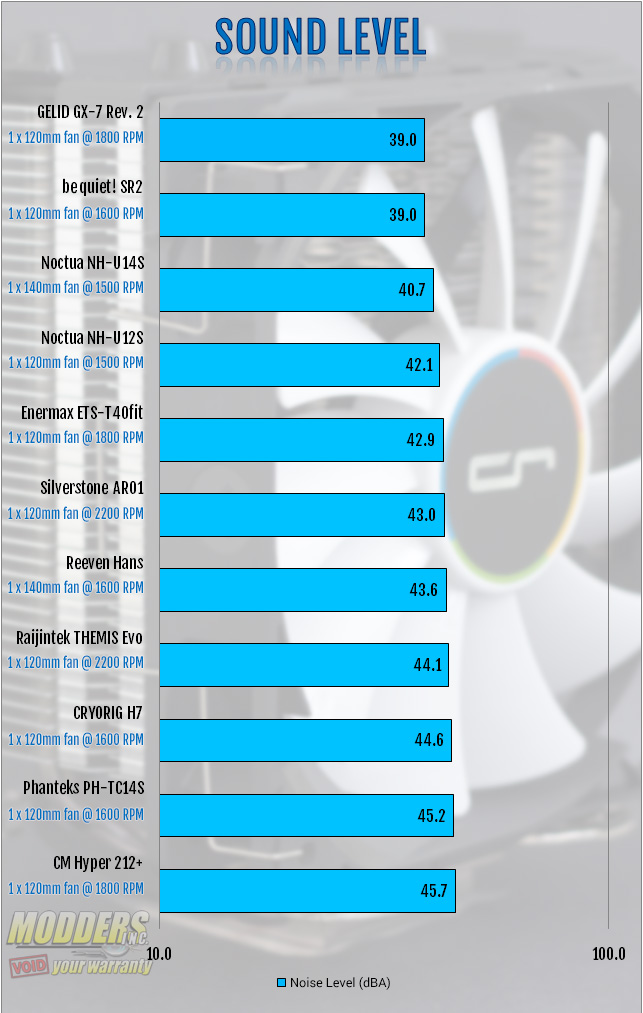
The American Recording Technologies SPL-8810 meter is placed 20-inches/50.8cm from the source fan to measure sound level. The entire test unit is moved to an acoustically treated room to get the ambient noise as low as controllably possible for real-world results. All other fans are disabled to eliminate sound sources that are not from the cooling unit itself that is being tested. This includes all case fans and all other component fan is shut off. The boiler during winter or the air conditioner during summer is also shut off to eliminate ambient noise further and sound testing is conducted from 2AM to 5AM so sound traffic from the outside is minimized as much as possible. Fan levels are controlled manually via software and at a separate time from the temperature testing.
Sound level measurement is logarithmic so it is on a separate graph than temperatures because it is on a completely different scale.
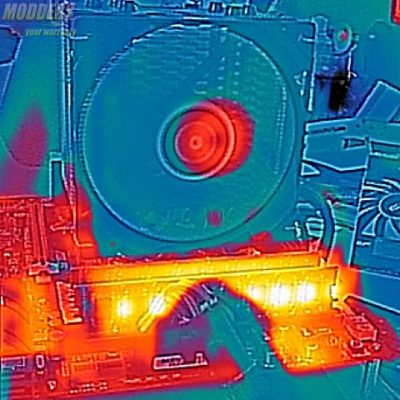
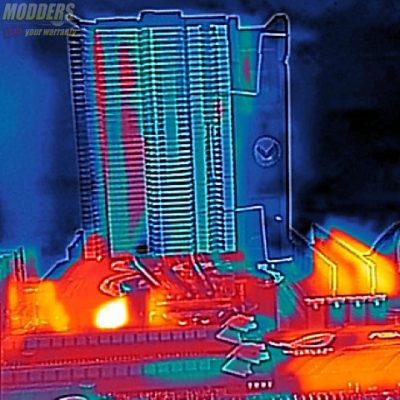
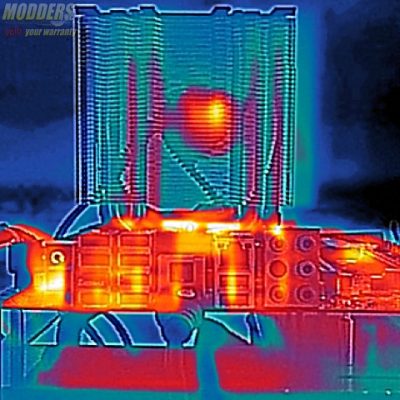
A FlirONE Thermal Imaging Camera was used to observe thermal behaviour under load. This is a lower-cost thermal imaging unit equipped with a low resolution thermal lens working in conjunction with a regular resolution camera lens to produces a composite image. Because of the FlirONE’s low resolution performance, it is not used as a benchmarking tool to measure temperature but rather a tool for observing thermal behaviour under load.
Benchmarks:
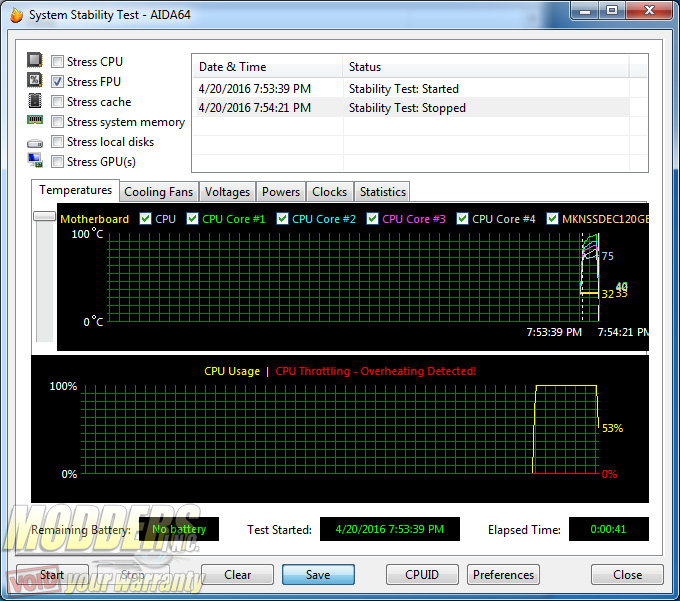
4.2GHz FPU-only load survival test: 40 seconds until CPU throttles
Sound Level @ max fan RPM:
Thermal behaviour (white with red bias are the hot parts, black with blue bias are the colder parts):
Sound Profile (Fan RPM vs Noise Level) – Room ambient noise is 34.8dBA:
| Fan Speed | QF120 fan |
| RPM | dBA |
| 1600 | 44.6 |
| 1500 | 44.4 |
| 1400 | 42 |
| 1300 | 39.8 |
| 1200 | 38.6 |
| 1100 | 37.2 |
| 1000 | 36.4 |
| 0900 | 35.6 |
| 0800 | 35.2 |
| 0700 | 35 |
