Biostar Hi-Fi Z97Z7 Motherboard: The Importance of Looking Good
Subsystem and Gaming Benchmarks
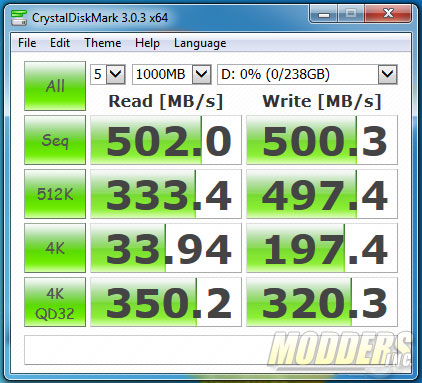
All SATA3 connections on the Biostar Hi-Fi Z97WE are provided by the Intel Z97 chipset and performs as expected.
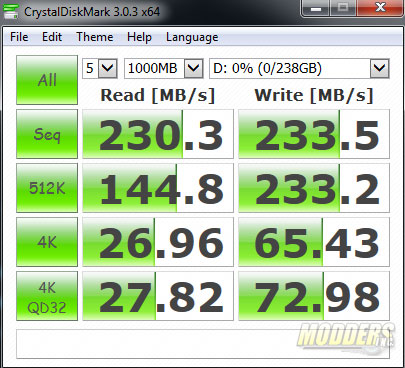
USB 3.0 ports are also natively provided by the Intel Z97 chipset.
On-board Audio
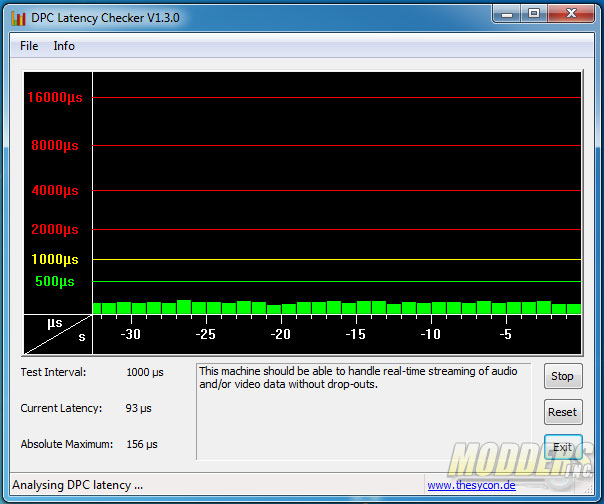
Before proceeding with audio benchmarks, Deferred Procedure Call latency must be first checked to make sure that the system is capable of producing useable results when the Rightmark Audio Analyzer benchmark was run. DPC is a Windows function that involves prioritizing tasks within the OS and high DPC latencies can be caused by several things including hardware device conflict. The DPC checker graphically displays the latency level of the system in real time so as long as the bars are in the green, the system should be able to handle audio and video streaming without drop outs or stutters.
Absolute maximum peaked at 156 while the system for the most part stayed well below that. It is also lower than the Biostar Z97WE. This means that there should be no hardware related issues or interruptions in terms of audio/video streaming performance while running the motherboard. Now we can run RightMark Audio Analyzer tests using a short 3-inch 3.5mm audioloop cable that goes in the line-in and line-out ports for a loopback test to objectively test internal audio performance. Although the Realtek ALC892 codec is capable of 24-bit, 192kHz the line-in port is limited to 16-bit, 192kHz so the loopback test will be limited at that setting. While the result cannot be directly compared to the results from previous motherboards tested on 24-bit, 96kHz and 192kHz such as the MSI Z97 MPower MAX, the result is comparable to other previously motherboards using an ALC892 chip such as the ASUS Z97-A as well as the Biostar Hi-Fi Z97WE.
Rear Audio:
| 16-bit, 96 kHz | ||
| Frequency response (from 40 Hz to 15 kHz), dB |
+0.11, +0.05
|
Excellent
|
| Noise level, dB (A) |
-90.1
|
Very good
|
| Dynamic range, dB (A) |
90.2
|
Very good
|
| THD, % |
0.0052
|
Very good
|
| THD + Noise, dB (A) |
-77.9
|
Average
|
| IMD + Noise, % |
0.012
|
Very good
|
| Stereo crosstalk, dB |
-87.2
|
Excellent
|
| IMD at 10 kHz, % |
0.011
|
Very good
|
| General performance |
Very good
|
|
| 16-bit, 192 kHz | ||
| Frequency response (from 40 Hz to 15 kHz), dB |
+0.02, -0.06
|
Excellent
|
| Noise level, dB (A) |
-90.7
|
Very good
|
| Dynamic range, dB (A) |
90.9
|
Very good
|
| THD, % |
0.0044
|
Very good
|
| THD + Noise, dB (A) |
-79.0
|
Average
|
| IMD + Noise, % |
0.012
|
Very good
|
| Stereo crosstalk, dB |
-85.6
|
Excellent
|
| IMD at 10 kHz, % |
0.011
|
Very good
|
| General performance |
Very good
|
|
The front headphone has a high-gain toggle accessible via the SmartEar software, so we test the two modes for the front as well, this time plugging in the line-in and the front audio out with the loopback cable.
Front headphone Lo-gain setting (100% volume playback and line-in record level adjusted):
| 16-bit, 96 kHz | ||
| Frequency response (from 40 Hz to 15 kHz), dB |
+0.02, -0.04
|
Excellent
|
| Noise level, dB (A) |
-88.0
|
Good
|
| Dynamic range, dB (A) |
88.0
|
Good
|
| THD, % |
0.0083
|
Very good
|
| THD + Noise, dB (A) |
-76.2
|
Average
|
| IMD + Noise, % |
0.015
|
Very good
|
| Stereo crosstalk, dB |
-83.5
|
Very good
|
| IMD at 10 kHz, % |
0.014
|
Very good
|
| General performance |
Very good
|
|
| 16-bit, 192 kHz | ||
| Frequency response (from 40 Hz to 15 kHz), dB |
+0.02, -0.07
|
Excellent
|
| Noise level, dB (A) |
-88.9
|
Good
|
| Dynamic range, dB (A) |
88.9
|
Good
|
| THD, % |
0.0086
|
Very good
|
| THD + Noise, dB (A) |
-76.2
|
Average
|
| IMD + Noise, % |
0.015
|
Very good
|
| Stereo crosstalk, dB |
-85.4
|
Excellent
|
| IMD at 10 kHz, % |
0.013
|
Very good
|
| General performance |
Very good
|
|
Front headphone Hi-gain setting (there is distortion/clipping on both channels detected on playback level over 70 so it was set there and line-in recording level is increased to get the clean test):
| 16-bit, 96 kHz | ||
| Frequency response (from 40 Hz to 15 kHz), dB |
+0.07, +0.01
|
Excellent
|
| Noise level, dB (A) |
-88.8
|
Good
|
| Dynamic range, dB (A) |
88.4
|
Good
|
| THD, % |
0.0031
|
Very good
|
| THD + Noise, dB (A) |
-78.7
|
Average
|
| IMD + Noise, % |
0.012
|
Very good
|
| Stereo crosstalk, dB |
-85.6
|
Excellent
|
| IMD at 10 kHz, % |
0.012
|
Very good
|
| General performance |
Very good
|
|
| 16-bit, 192 kHz | ||
| Frequency response (from 40 Hz to 15 kHz), dB |
+0.02, -0.07
|
Excellent
|
| Noise level, dB (A) |
-89.2
|
Good
|
| Dynamic range, dB (A) |
88.7
|
Good
|
| THD, % |
0.0030
|
Very good
|
| THD + Noise, dB (A) |
-79
|
Average
|
| IMD + Noise, % |
0.012
|
Very good
|
| Stereo crosstalk, dB |
-84.4
|
Very good
|
| IMD at 10 kHz, % |
0.011
|
Very good
|
| General performance |
Very good
|
|
Network Connectivity
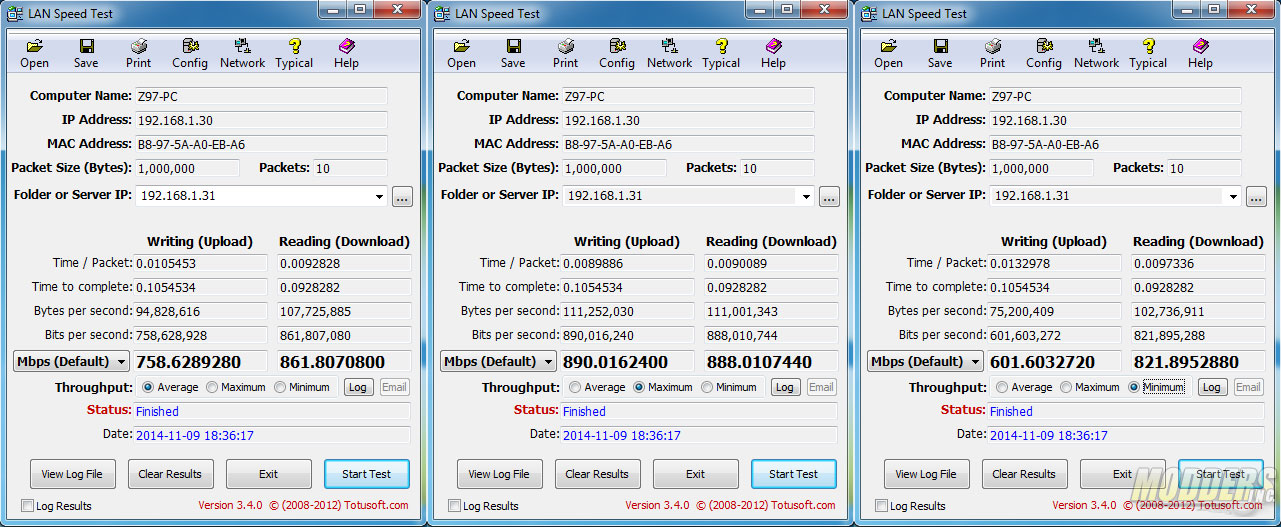
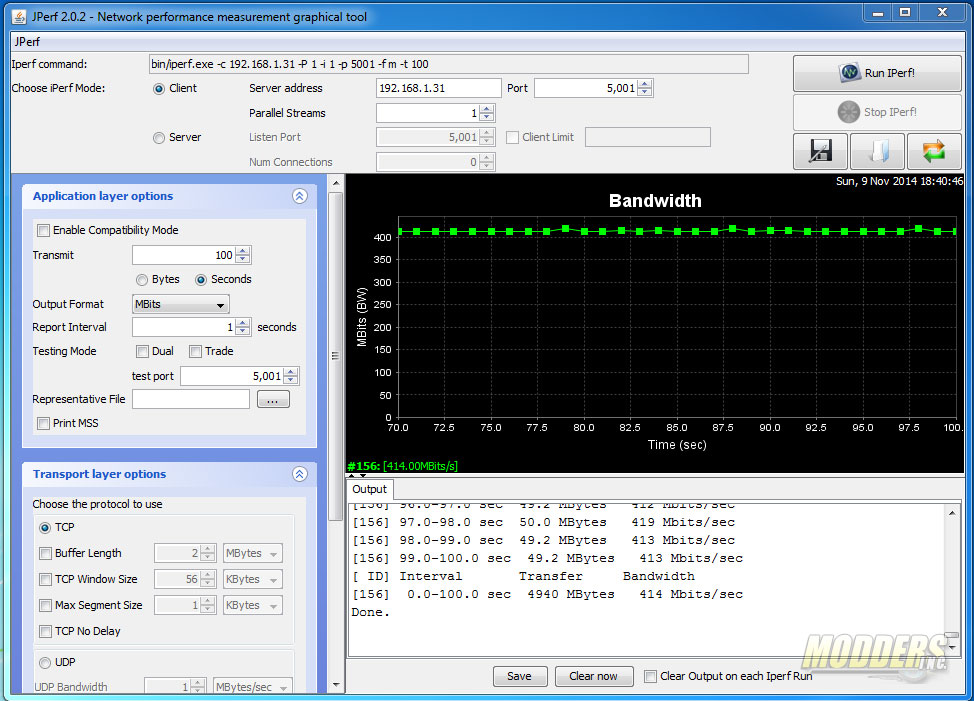
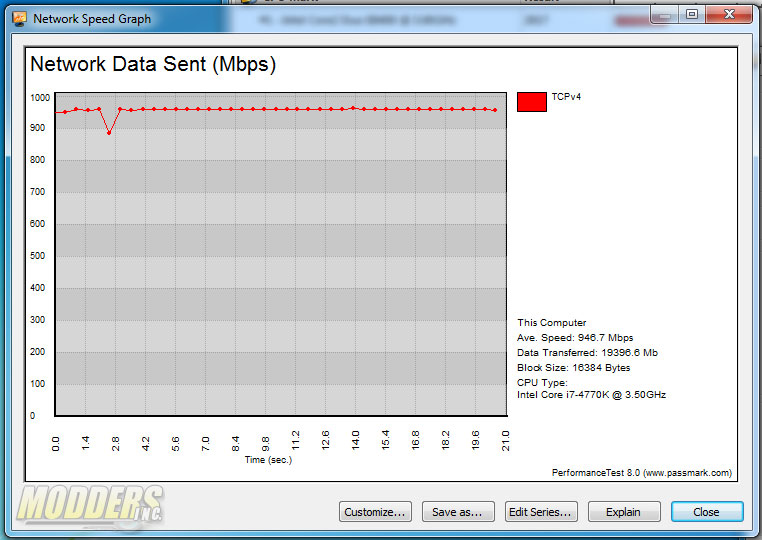
Network testing was conducted with a 4-port Cisco E3200 Gigabit Dual-Band Wireless N router and a pair of 10-ft long Cat5E cables connecting the server PC and the test motherboard. The server system is running an Intel Core i7-3960X processor on an ASUS P9X79 WS motherboard with an Intel 82574L Gigabit LAN Controller. Interrupt Moderation was disabled.
Network performance is good even for a budget motherboard. Since it is a non-Intel solution however, CPU power consumption peaked at 14% during testing.
Gaming Tests
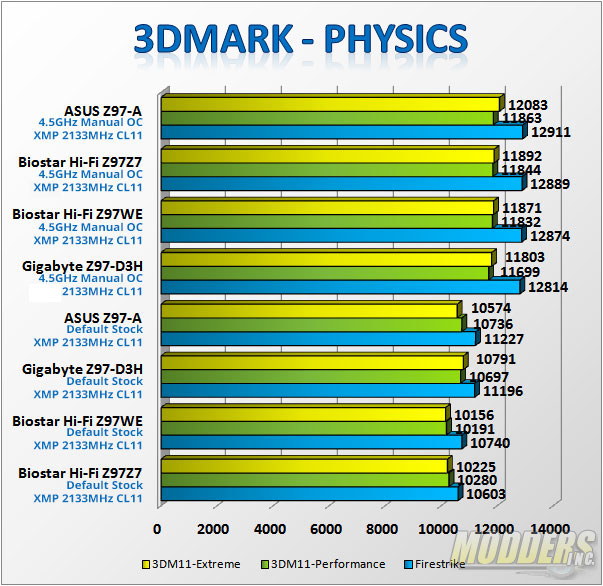
Futuremark’s 3DMark is a semi-synthetic gaming benchmark that calculates both graphics and CPU-bound physics in a controlled series of tests and provides scores that can be compared with other gaming platforms.
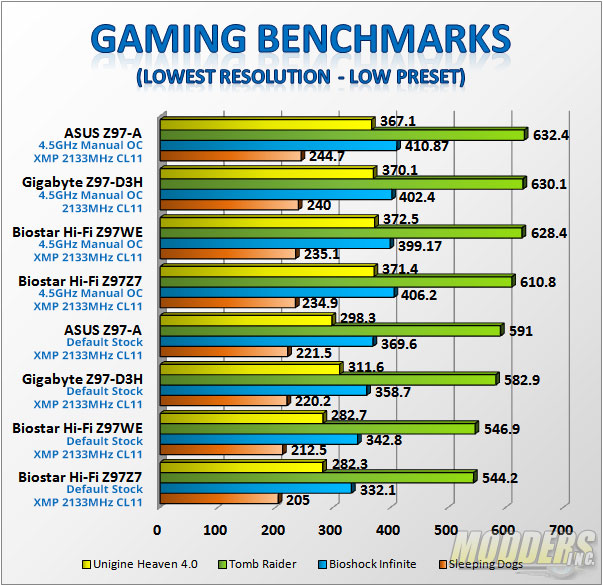
Instead of showing real-world gaming performance, a gaming test at the lowest resolution where CPU performance difference can be gauged due to the reduced reliance on the discrete GPU was conducted.
