Testing Methodology
| System Configuration | |
| Case | Open Test Table |
| CPU | Intel Core i7 8700K |
| Motherboard | Gigabyte AORUS Z370 ULTRA GAMING |
| Ram | (2) 8GB Corsair DDR4-3200 CMW16GX4M2C3200C16 |
| GPU | EVGA GTX 1080 (8Gb) |
| Hard Drives | Corsair Force MP510 NVMe Gen 3 x4 M.2 SSD (480Gb) |
| Network Cards | Dual Port Intel Pro/1000 PT
Mellanox Connectx-2 PCI-Express x 8 10GbE Ethernet Network Server Adapter |
| Switches | MikroTik Cloud Router Switch CRS317-1G-16S+RM (SwitchOS) Version 2.9
Transceivers used: 10Gtek for Cisco Compatible GLC-T/SFP-GE-T Gigabit RJ45 Copper SFP Transceiver Module, 1000Base-T 10Gtek for Cisco SFP-10G-SR, 10Gb/s SFP+ Transceiver module, 10GBASE-SR, MMF, 850nm, 300-meter 10Gtek for Cisco SFP-10G-T-S 10GBase-T SFP+ 10 Gigabit RJ45 Copper Transceiver 30m |
| Power Supply | Thermal Take Tough Power RGB 80 Plus Gold 750W |
4 Seagate IronWolf 8 TB NAS drives were installed and used in the NAS tests.
A Single port Mellanox Connectx-2 PCI-Express x 8 10GbE Ethernet Network Server Adapter network card was installed in the test system.
Asustor AS4004T in all RAID arrays used a Single Static Volume. SFP-10G-T-S (10GbE) adapter was used for all 10GbE benchmarks.
Network Layout
For all tests, the NAS was configured to use a single network interface. Network cards were used to test 1Gbps (copper) and 10 Gbps (SFP+) connections. For 1Gbps connection one CAT 6 cable was connected to the MikroTik CRS317-1G-16S+RM from the NAS and one CAT 6 cable was connected to the workstation from the switch. Testing was done on the PC with only 1 network card active. For 10Gbps connection one Cat 6 cable was connected to MikroTik CRS317-1G-16S+RM from the NAS and one Fiber 10Gb cable was connected to the workstation from the switch. The switch was cleared of any configuration. Jumbo frames were used (9000 MTU) on the workstation, NAS and the switch.
Network drivers used on the workstation are 5.50.14643.1 by Mellanox Technologies. (Driver Date 8/26/2018) (10GbE adapter) and 9.15.11.0 by Intel (Driver Date 10/14/2011)
Software
All testing is done based off a single client accessing the NAS.
Both of the software were installed on the RAM Drive by ImDisk Virtual Disk Driver.
Crystal Disk Mark is an old favorite disk benchmarking software which we have used for many years. It provides us with useful information on read and write speeds of the targets. You can get your own free copy right here.
ATTO Disk Benchmark gives a good insights on the read and write speeds of the drive. In our tests, we used it against the “share” on the NAS. ATTO Disk Benchmark could be download right here.
All tests were run a total of three times then averaged to get the final result.
RAID 0,5 and 10 were tested for 1GbE and 10GbE connections.
Tests were run after all the RAID arrays were fully synchronized.
RAID Information
 |
 |
 |
 |
 |
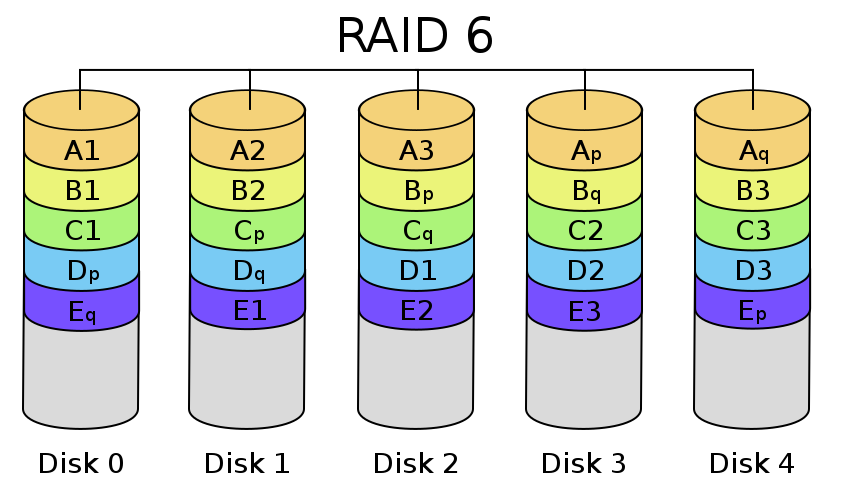 |
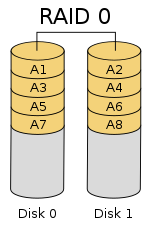
| Images courtesy of Wikipedia | ||
JOBD or Just a Bunch Of Disks is exactly what the name describes. The hard drives have no actual raid functionality and are spanned at random data is written at random.
RAID 0 is a stripe set and data is written across the disks evenly. The advantage of RAID 0 is speed and increased capacity. With RAID 0 there is no redundancy and data loss is very possible.
RAID 1 is a mirrored set and data is mirrored from one drive to another. The advantage of RAID 1 is data redundancy as each piece of data is written to both disks. The disadvantage of RAID 1 is write speed is decreased as compared to RAID 0 due to the write operation is performed on both disks. RAID 1 capacity is that of the smallest disk.
RAID 10 combines the 1st two raid levels and is a mirror of a stripe set. This allows for better speed of a RAID 0 array but the data integrity of a RAID 1 array.
RAID 5 is a stripe set with parity. RAID 5 requires at least 3 disks. Data is striped across each disk, and each disk has a parity block. RAID 5 allows the loss of one drive without losing data. The advantage to RAID 5 is read speeds increase as the number of drives increase but the disadvantage is write speeds are slower as the number of drives is increased. There is overhead with RAID 5 as the parity bit needs to be calculated and with software RAID 5 there is more of a performance hit.
RAID 6 expands on RAID 5 by adding an additional parity block to the array that is distributed across all the disks. Since there are two parity blocks in the array more overhead is used with a RAID 6 array.
For a full breakdown of RAID levels, take a look at the Wikipedia article here.
RAID configurations are a highly debated topic. RAID has been around for a very long time. Hard drives have changed, but the technology behind RAID really hasn’t. So what may have been considered ideal a few years ago may not be ideal today. If you are solely relying on multiple hard drives as a safety measure to prevent data loss, you are in for a disaster. Ideally, you will use a multi-drive array for an increase in speed and lower access times and have a backup of your data elsewhere. I have seen arrays with hot spares that had multiple drives fail and the data was gone.
