ASUS Z390 ROG Maximus XI Apex Motherboard Review
The Apex of Performance on Z390
General Performance Benchmarks
AIDA64 ENGINEER
AIDA64 has a set of several 64-bit benchmarks to measure how fast the computer performs various data processing tasks and mathematical calculations. Multi-threaded memory and cache benchmarks are available to analyze system RAM bandwidth and latency. Benchmark pages of AIDA64 Extreme provide several methods to measure system performance. These benchmarks are synthetic, so their results show only the theoretical maximum performance of the system. The AIDA64 suite has various benchmarks for CPU, FPU, GPU, storage and memory testing.
Memory Testing
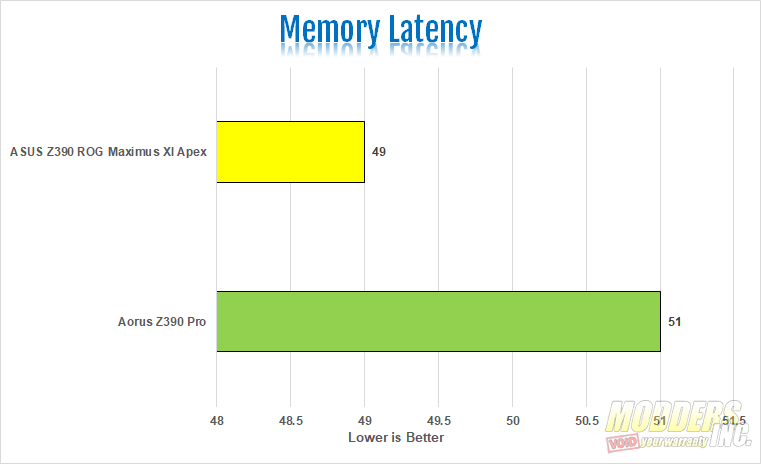
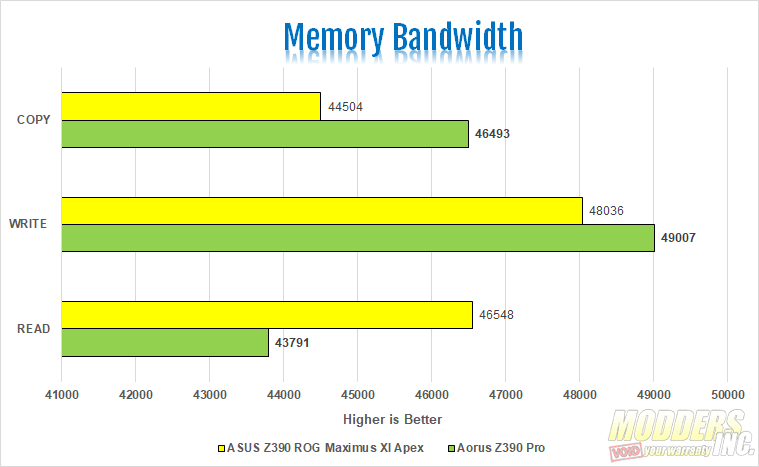
The memory used in this review has been my go-to kit for any review that isn’t memory for the last few years. Its a 32 GB kit of G. Skill Trident Z DDR4 3200 MHz CAS 14, non-RGB memory. The same kit was used in the testing of both motherboards. All testing was done with XMP Profile #1 enabled. On the Aida64 Latency test, out Trident Z kit achieved 51 milliseconds on the Aorus Z390 Pro and 40 milliseconds on the Z390 Maximus XI Apex. As for memory bandwidth, The Apex did better on the read speed with a speed of 46548 Mbit/s. However, the Aorus Z390 Pro did achieve better write and copy speeds. The write speed on the Z390 Aorus Pro was 49007 Mbit/s to the 48036 Mbit/s on the Apex. The Copy speed had similar results with the Z390 Pro hitting 46493 Mbit/s and the Apex hitting 44504 Mbit/s.
CPU Testing
CPU Queen is an integer benchmark that tests branch prediction and misprediction penalties. CPU PhotoWorxx tests the SIMD integer arithmetic execution units of the CPU and the memory subsystem. CPU ZLib is a compression benchmark that tests the combined CPU and memory performance. CPU AES is a multi-core encryption benchmark that uses Advanced Encryption Standard data encryption. CPU Hash is an integer benchmark that measures performance using the SHA1 hashing algorithm. FPU Julia measures single-precision FP, FPU Mandel measures double-precision FP, FPU Sin Julia measures extended precision FP while FPU VP8 is a video compression test utilizing the FPU Julia fractal module.
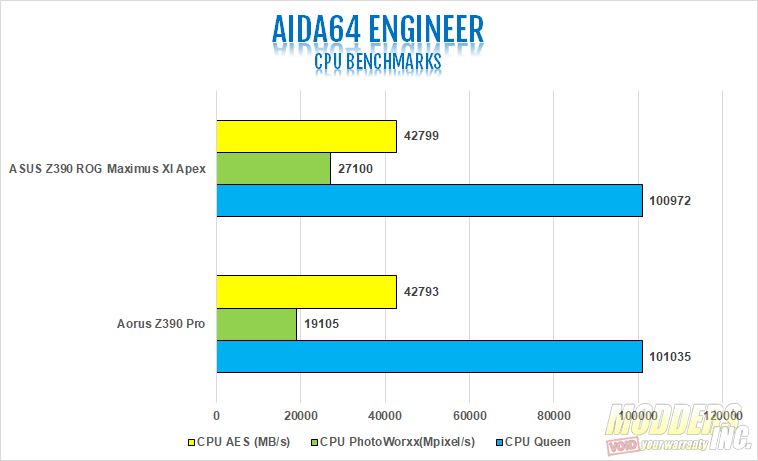
For the Aida64 CPU and FPU benchmarks, our 9900k ran neck and neck on the two motherboards with the Z390 Maximus XI Apex coming out slightly ahead of the Z390 Pro in all tests but one. The Aida64 CPU Queen test was the solo benchmark in which the Z390 Maximus XI Apex didn’t come out on top. In CPU Queen, The Z390 Pro achieved a score of 101035 to the 100972 the Apex scored. The CPU AES test had the biggest difference between the two. The Apex achieved a speed of 27100MB/s to the 19105 MB/s on the Z390 Pro. The Photoworxx was very close with the Apex hitting 42799 Mpixel/s to the 42792 Mpixel/s on the Z390 Pro
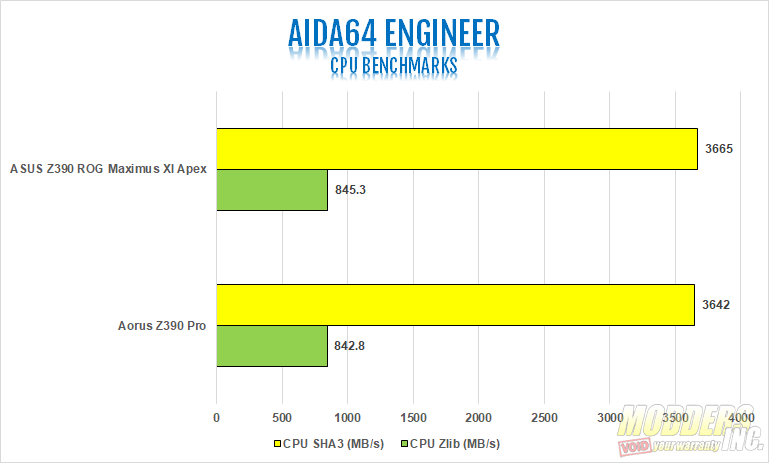
In the CPU Zlib test, the Apex was again the winner with a speed of 845.3 MB/s over the 842.8 MB/s on the Z390 Pro. The Latest version of Aida64 replaced the CPU Hash test with the CPU SHA3 test. Again, the Apex won this round with a speed on 3665 MB/s in CPU SHA3 where the Z390 Pro hit a speed of 3642 MB/s. Again, very close.
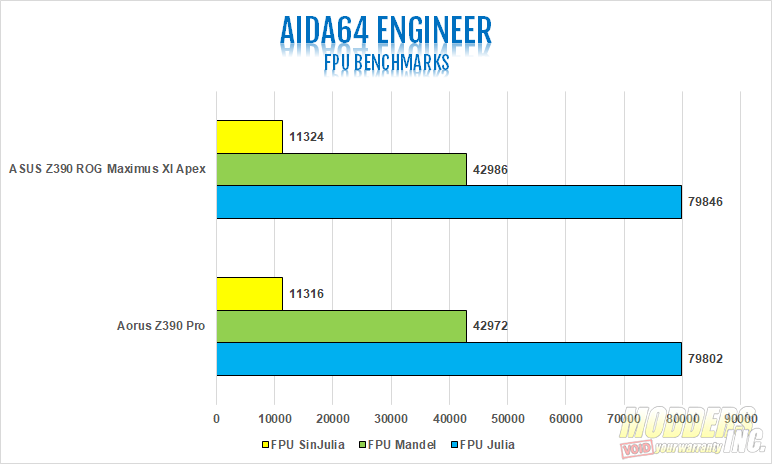
The Aida64 benchmark has three FPU tests on top of the CPU tests. These tests are SinJulia, Mandel, and Julia. The Z390 Maximus Apex won out on the FPU tests in Aida64. In the FPU Julia test, the Apex scored 79846 to the 79802 of the Z390 Pro. In Mandel, the Apex scored 42986 to the 42972 on the Z390 Pro. Last was Sinjulia where the Apex scored 11324 to the 11316 of the Z390 Pro.
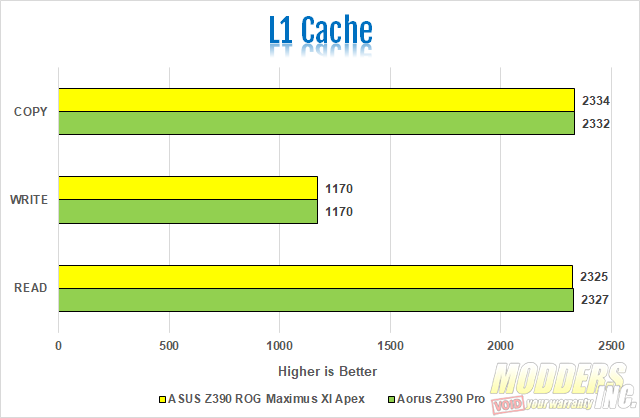
The L1, L2 and L3 cache is measured in MB/s on the Read, Write and Copy speeds. The test results were very similar as we used the same kit on both boards. The L1 cache was neck and neck with the Apex doing better on the Copy speed, by 2 MB/s. beating the Z390 Pro 2334 to 2332. The write was tied 1170 MB/s to 1170 MB/s. On the Read, the Z390 Pro came out ahead 2327 MB/s to 2325 MB/s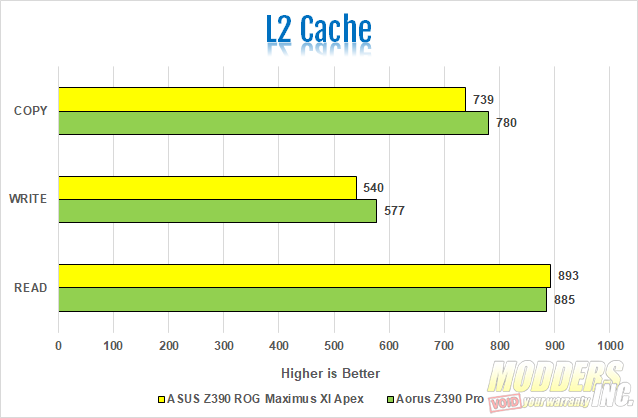
On the L2 cache, the Apex beat out the Z390 Pro on only the read speed 893 MB/s to 885 MB/son the Z390 Pro. On the Write speeds, the Z390 Pro hit 577 MB/s to 540 MB/s on the Apex. The Copy speed was more of the same. The Z390 Pro hit 780 MB/s on the copy speed to the 739 MB/s on the Apex.
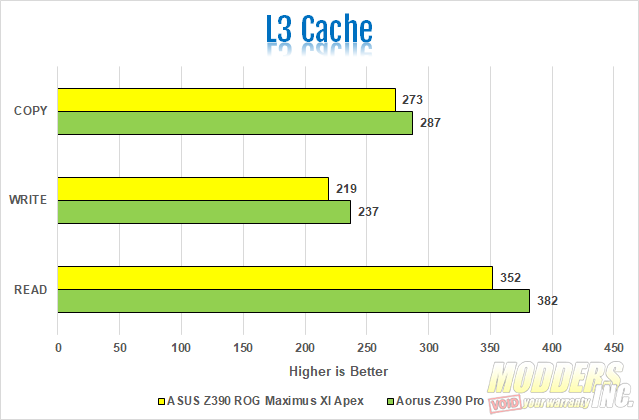
The L3 Cache was the one test in which the Z390 Pro won outright on the Read, Write and Copy. On the read, the Z390 Pro hit 382 MB/s to the 352 MB/s on the Apex. For the write speed, the Z390 Pro achieved a speed of 237 MB/s to the 219 MB/s on the Apex. Last was the Copy where the Z390 Pro hit 287 MB/s to the 273 MB/s on the Apex.
Cinebench R15
Based on MAXON’s award-winning animation software Cinema 4D, CINEBENCH is a real-world cross-platform test suite that evaluates your computer’s performance capabilities. It has both the single thread and full performance test for your CPU, as well as an Open-GL test for your GPU. Cinebench R15 is one of the most widely used benchmarks used to test the performance. It puts the CPU under 100% load, but only for a very short time. It gives a good baseline for your CPU. However, I wouldn’t use it for testing the stability of an overclock.
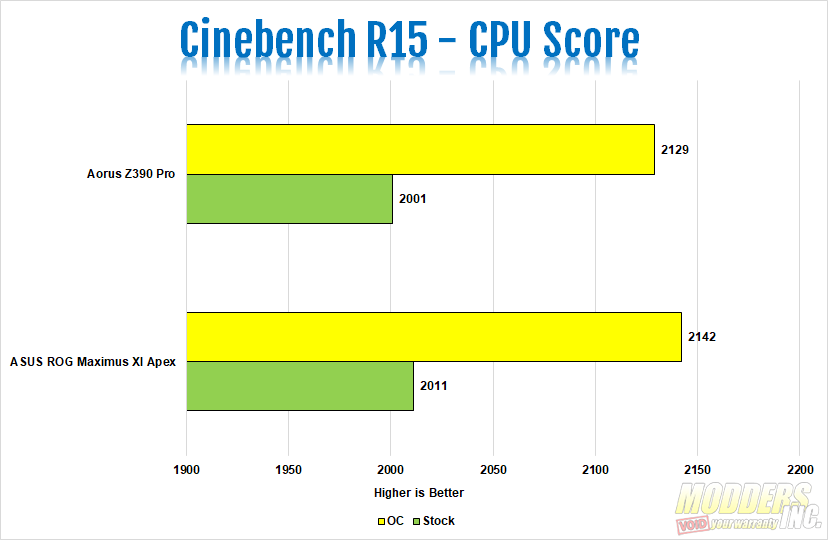
Although they have released Cinebench R20, I still use Cinebench R15 more because I’m used to it. In Cinebench R15, again, we used the same chip on both boards. We tested the I9-9900k at both stock and overclocked settings. Our overclock being 5.2 GHz at 1.35 volts. Before this review, my best Cinebench R15 score on the 9900k had been 2037 CB on multi-core and 212 on a single core. Those scores were achieved on the Z390 Aorus Xtreme Waterforce. On the Z390 Pro, we achieved scores of 2001 at stock and 2129 while overclocked. I was very pleased with this score where it had been the highest I had ever achieved on the 9900k. That was until I installed our I9-9900k on the Z390 Maximus XI Apex. At stock, we hit 2011 CB on the Apex. With the processor overclocked, we hit 2042 CB. This is the best score I’ve achieved with this particular processor.
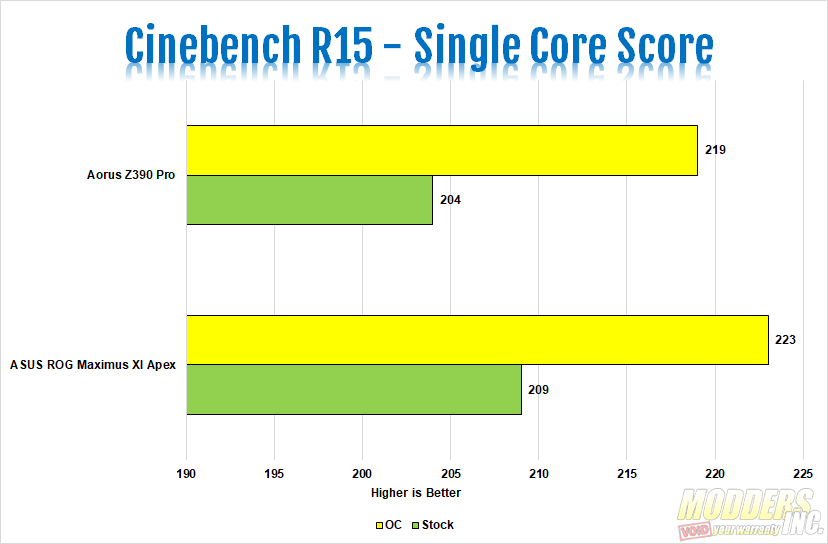 The single-core test was a bit closer on Cinebench R15. On the Z390 Pro, we achieved a single-core score of 204 CB at stock. Overclocked, our 9900k hit 219 CB on the single-core test on the Z390 Pro. On the Apex, at stock, out 9900k hit 209 CB. While overclocked, we achieved a score of 223 CB on the Cinebench R15 single-core test while running our 9900k on the Z390 Maximus XI Apex.
PCMark 10
PCMark 10 is the successor to PCMark 8 and the latest complete system benchmark from UL, formerly Futuremark. In their own words “PCMark 10 features a comprehensive set of tests that cover the wide variety of tasks performed in the modern workplace. With express, extended, and custom run options to suit your needs, PCMark 10 is the complete PC benchmark for the modern office.”
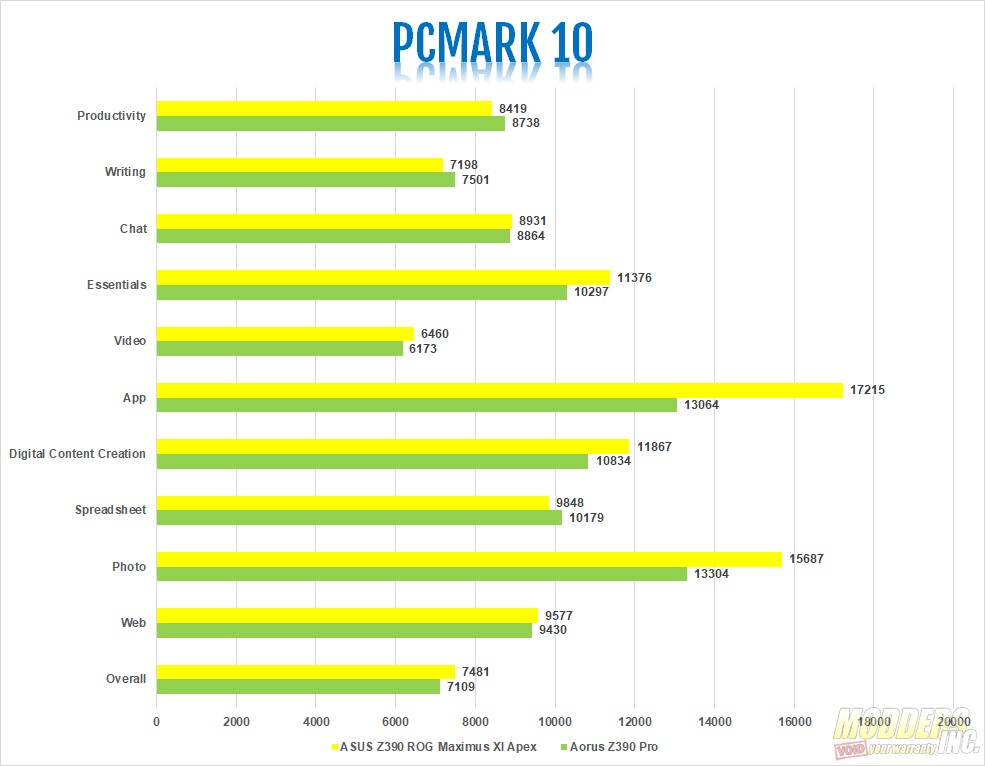
In PCMark 10, The Z390 Maximus XI Apex did outperform the Z390 Pro overall. However, there were a couple of tests in the overall suite that the Z390 Pro did perform better on. In the spreadsheet test, the Z390 Pro scored 10179 to the 9848 of the Apex. Also, the Z390 Pro came out ahead on the writing and productivity tests. On writing, the Z390 Pro scored 7501 to the 7198 on the Apex. For Productivity, the Z390 Pro beat out the Apex 8738 to 8419. On the rest of the suite, the Z390 Maximus XI Apex beat out the Z390 Pro. For example, on the App test, the Apex won by a score of 17215 to 13064 on the Z390 Pro.
