Multimedia, Compression and Semi-Synthetic Benchmarks
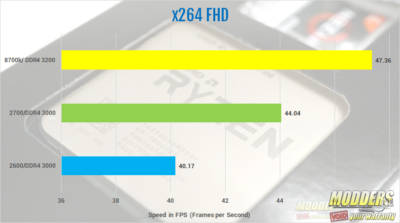
X264 FHD
x264 is a free software library for encoding video streams into the H.264/MPEG-4 AVC format. x264 FHD measures how efficient a system is in encoding H.264 video and produces results in frames-per-second. H.265/HEVC video encoding is the future of video able to compress significantly larger resolution videos including 4K and make streaming a possibility. The 2700 ran the x264 FHD benchmark at an average of 44.04 frames per second.
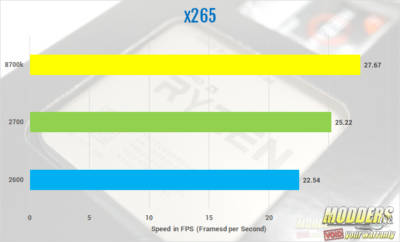
X265
x265 is an open-source implementation of the H.265 standard and x.265 HD benchmark tests the CPU’s ability to process an HEVC video. This benchmark is run by the processor alone. The 2700 averaged 25.22 frames per second.
7-Zip
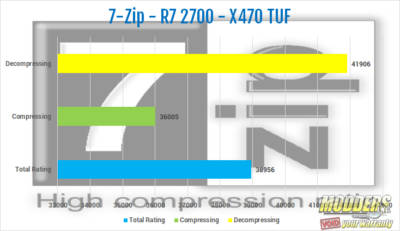
The 7-zip benchmark shows a rating in MIPS (million instructions per second). The rating value is calculated from the measured speed, and it is normalized with results of Intel Core 2 CPU with multi-threading option switched off. So, if you have modern CPU from Intel or AMD, rating values in single-thread mode must be close to real CPU frequency. There are two tests, compression with LZMA method and decompression with LZMA method. Once the total passes reach 100, the score is taken. 7-Zip gives the resulting score for decompressing, compressing and an overall score. The Decompressing score for the 2700 was 41906 MIPS, or Million Instructions per Second. The Compression score was 36005 MIPS and the overall score was 38956 MIPS.
WINRAR
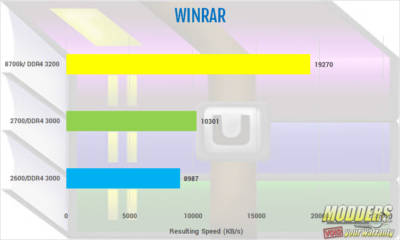
WinRAR is a file archiver utility for Windows, developed by Eugene Roshal of win.rar GmbH. It can create and view archives in RAR or ZIP file formats and unpack numerous archive file formats. Both the 2600 and 2700 ran Winrar for about 20 minutes each. The final results for the 2600 were 8987 KB/s. The results for the 2700 was 10301 KB/s. We’ve also included results from the I7 8700k.
Handbrake
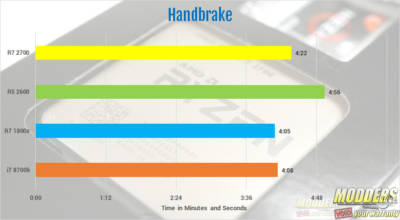
HandBrake is a free and open-source video transcoder, originally developed in 2003 by Eric Petit to make ripping a film from a DVD to a data storage device easier. Essentially, it can convert video to almost any modern format. HandBrake is available for Linux, macOS, and Windows. The workload video file is a ~6.27 GB, 3840 x 1714, 73.4 Mbps, 24fps, H.264, .mov video file that is transcoded to a ~1480 MB, 1920×858, ~17.1 Mbps, 24fps, H.264, .mp4 video file. The video file is called Tears of Steel. The R7 2700 encoded the file in 4 minutes and 22 seconds, a bit slower than the 1800x and the I7 8700k. However, it was only off by a bit. Still, overall, a good performance.
PCMark 8
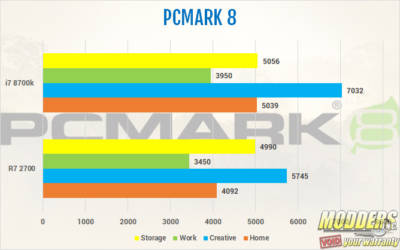
The PCMark 8 Storage benchmark is used to test the performance of SSDs, HDDs and hybrid drives with traces recorded from Adobe Creative Suite, Microsoft Office and a selection of popular games. You can test any recognized storage device, including local and external drives. Unlike synthetic storage tests, the PCMark 8 Storage benchmark highlights real-world performance differences between storage devices. We ran all three of the conventional benchmarks PCMARK 8 has to offer. These are Work, Creative, Home and we also ran the Storage benchmark. All benchmarks were the conventional, as opposed to the accelerated. For comparison, I’ve added results from my last two reviews. I’ve included results from the I7 8700k as well. As you can see, the 2700 comes in just under the 8700k.
Performance Test 9
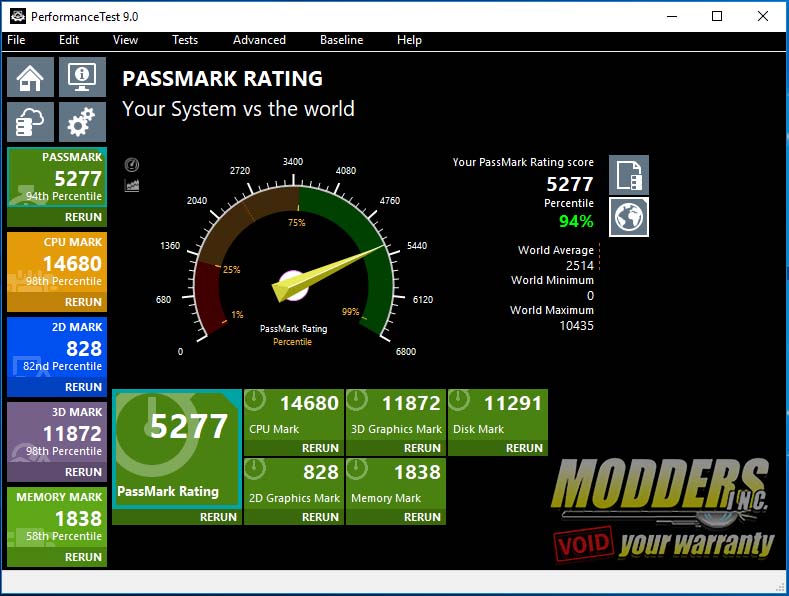
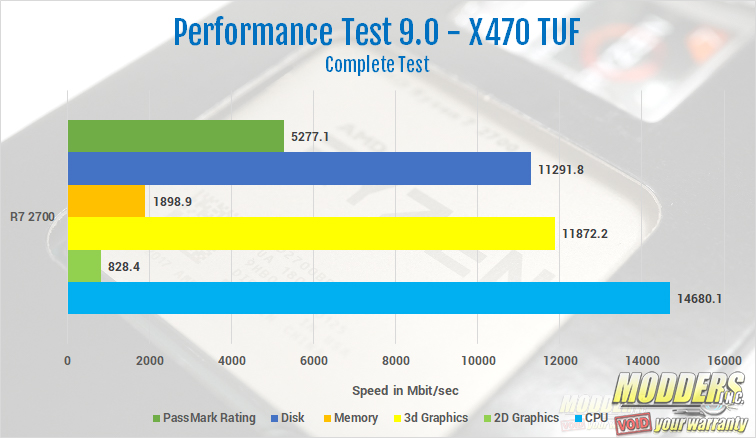
Performance Test 9 is a complete system benchmark that tests every main component of your system. The area’s tested are the Disk, Memory, 2D Graphics, 3D Graphics, and CPU. There is also an overall PassMark Rating. On the CPU test, theR7 2700 score of 14680.1. Next was the 2D graphics score of 828.4. The 3D Graphics score was 11872.2. The memory score was 1898.9. The disk score was 11291.8. The overall score was 5277.1. Our test system scored in the 94 percentiles. All of these results are listed in the chart below.
