ASUS Sabertooth 55i Motherboard
Observation |
With the installation process complete, it’s time to move on to the testing process. Using the X58 based rig as the comparison should give us a close head to head battle with the 55i. As you can see, we kept everything pretty close on the builds without actually having duplicates of everything. Overclocking:
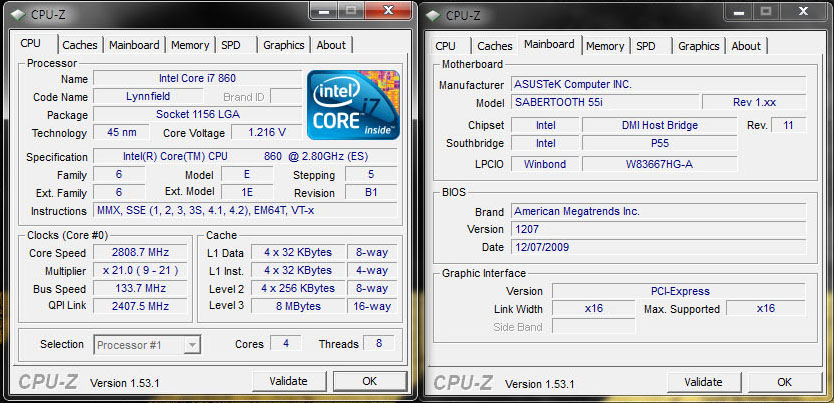 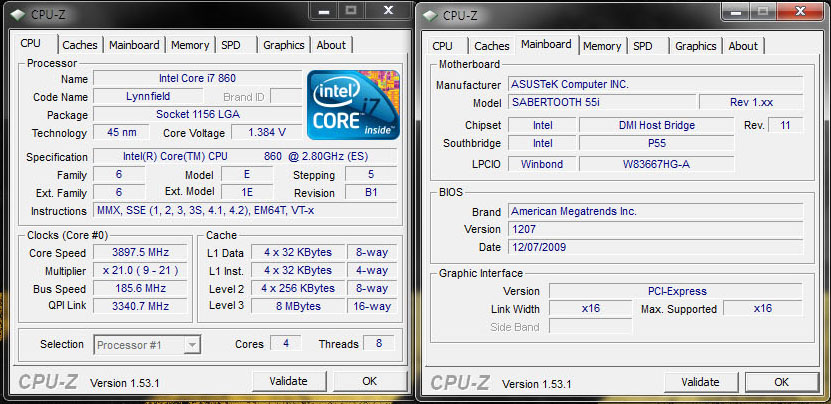 Before diving into the testing process, we needed to see how the Sabertooth 55i handled overclocking. After playing with some settings we was able to easily achieve an overclock of 4.1 Ghzon air with the Core i7 860. The comparison rig runs happily at 3.8 GHz on a daily basis, so we decided to test the Sabertooth at both the stock clocks and at 3.8 GHz to keep the playing field as even as possible. Power Consumption:
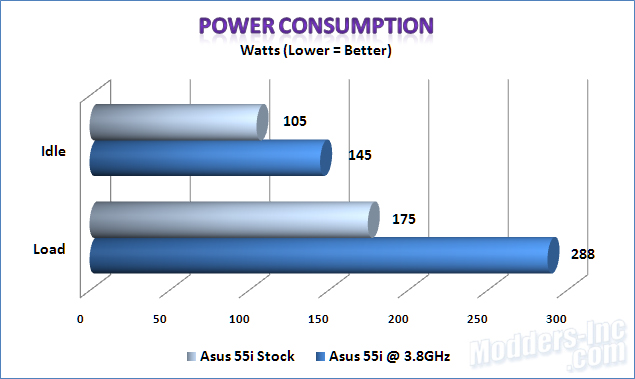 Once we decided on the final overclock we would be using, we did a couple of runs to get our power consumption results. As we can see by the above chart, at stock levels the Sabertooth build is pretty mild coming in at just over 100W at idle and just under 150W at full load. Keep in mind, these numbers are measured at the wall, rather than at the PSU. Using the 850W Seasonic M12D might be a little overkill… It’s getting the job done. CPU Performance:
SiSoftware Sandra 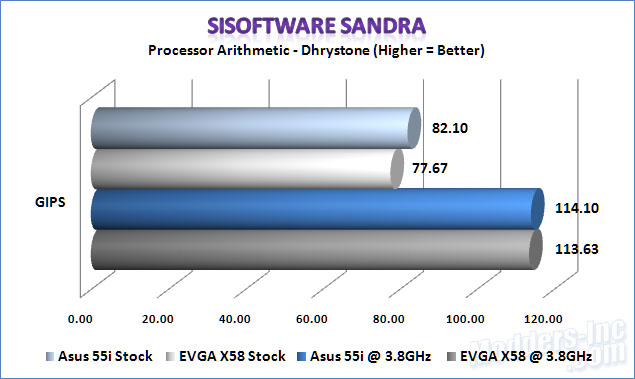 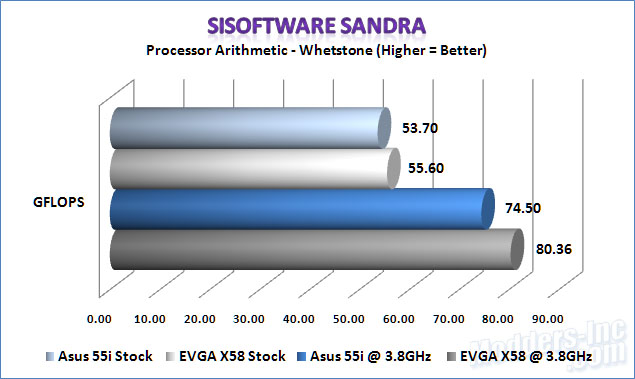
For the first test in the CPU performance, we ran SiSoftware Sandra’s Processor Arithmetic tests. Looking at the charts above, we can see that the Sabertooth 55i has a slight lead in the Dhrystone test, while the X58 carried that slight advantage in the Whetstone test. With such a close result on both tests, its really hard to say which configuration has the best advantage at this point.
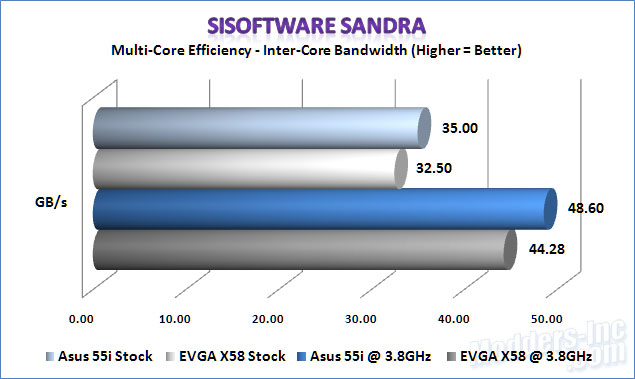 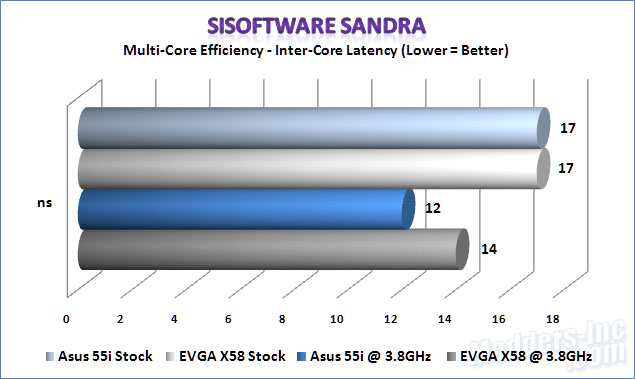 Next up we ran SiSoftware Sandra’s Multi-Core Efficiency tests. Again, we have a very small variation in the differences between the two configurations. The Sabertooth 55i does show a slight advantage of roughly 3 to 4 GBs per second over the X58. SuperPI
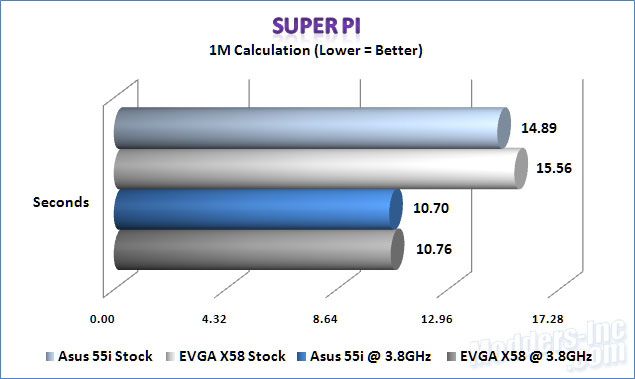 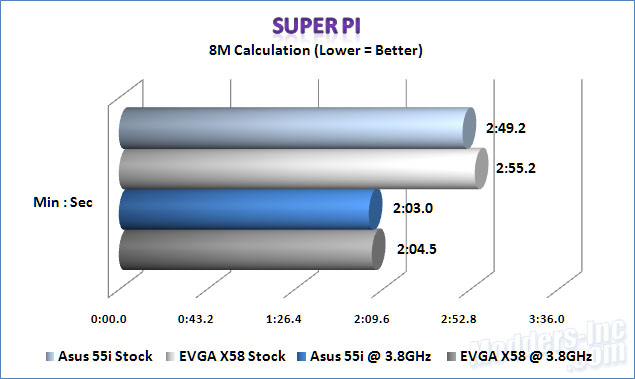
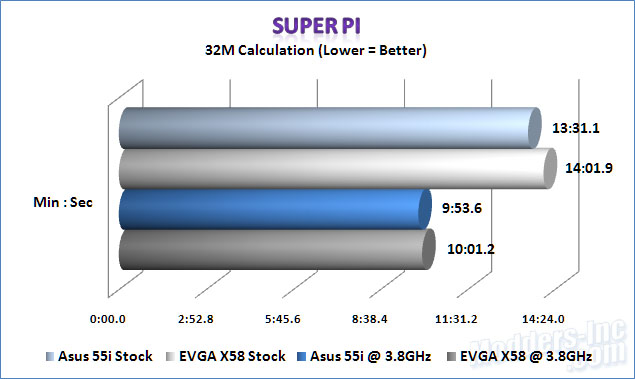
To see measure how both rigs handled crunching numbers, we ran multiple passes of Super-Pi (1M, 8M, and 32M calculations). Looking at the three charts above, we see that the Sabertooth 55i took a slight lead during the 1M calculation and kept it through the remaining two tests. PassMark
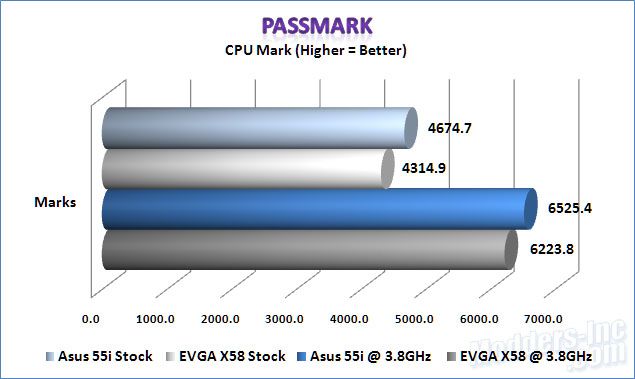
Closing out the CPU performance test we pulled out PassMark and ran the CPU tests. We ran a total of three tests each on both configurations and averaged the results for our charts. Looking at the above results in the chart, we show the Sabertooth 55i pulled in a commanding lead by 300+ CPU Marks.
Memory Performance:
SiSoftware Sandra
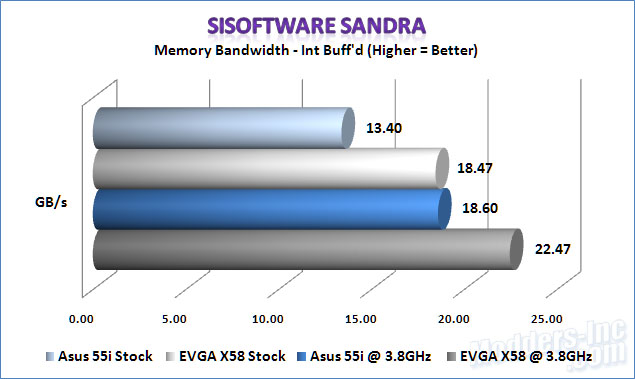 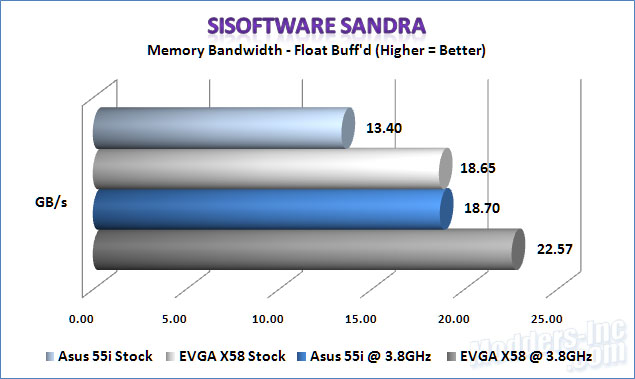
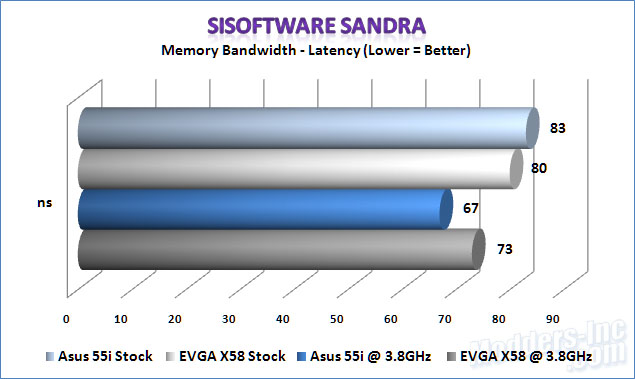
Running SiSoftware Sandra’s memory bandwidth tests shows the X58 taking a slight advantage in both the Int and Float tests by 4 – 5 GBs per second. We did see the latency results swap sides on the overclocking side though.
Everest
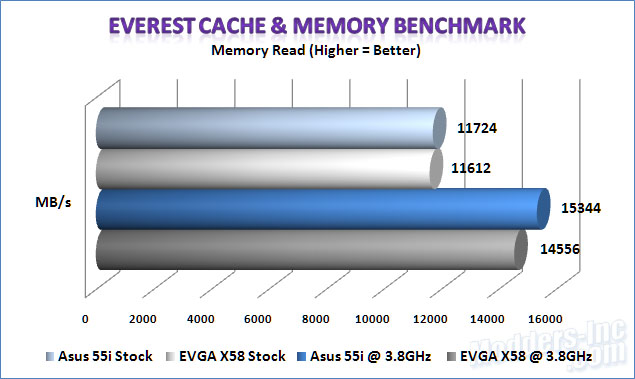 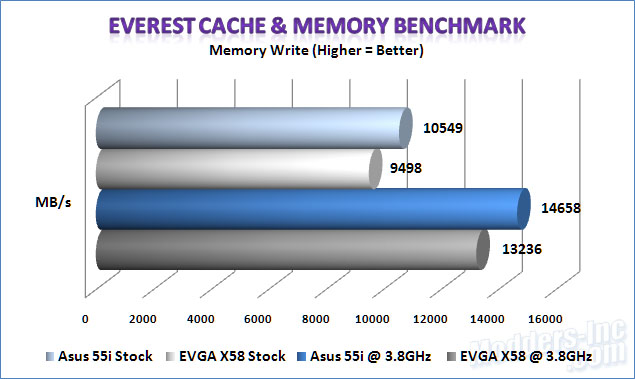
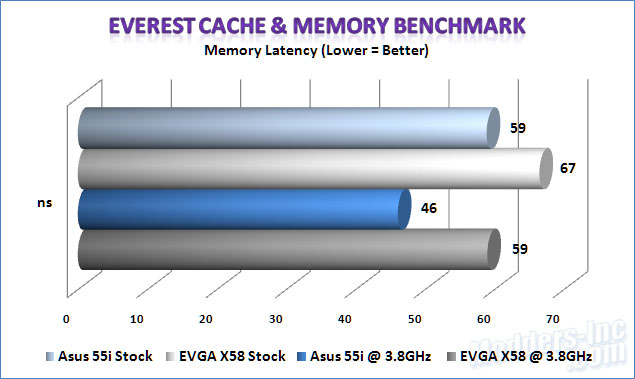
We then pulled out Lavalys Everest Ultimate Edition and ran the Cache & Memory Benchmark. This time around we show the Sabertooth 55i taking the lead in the Read and Write tests by roughly 1000 ~ 1500 MBs per second. Everest also showed the Sabertooth 55i having a slightly improved latency timing. Hard Disk Performance: HD Tune
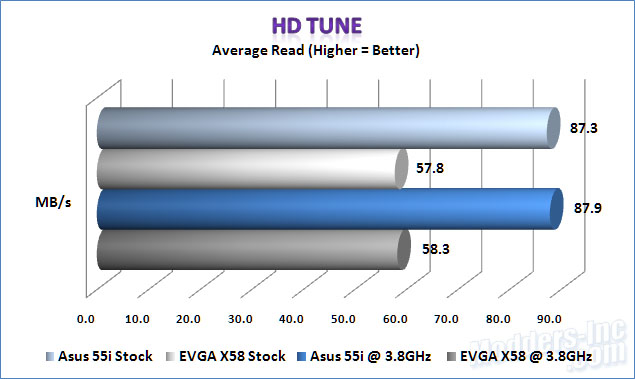 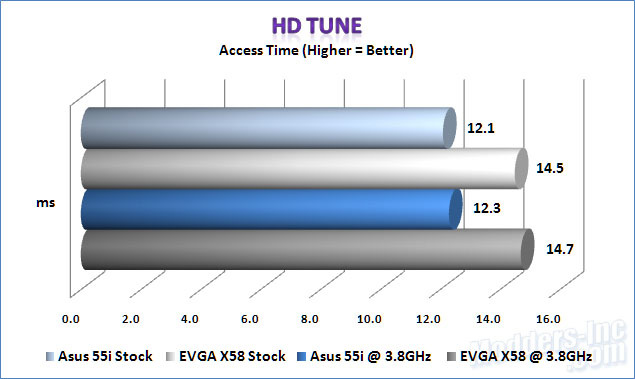
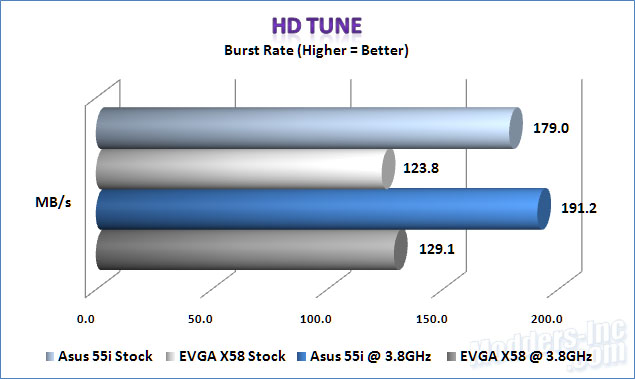
For the first test under Hard Drive performance we fired up HD Tune. For this test we tracked the Access Times, Average Read speeds, and the Burst Rate on both configurations. The Sabertooth 55i configuration showed a 23+ MB per second advantage over the X58 configuration, while we seen a much larger advantaged during the Burst Rate test of 56+ MBs per second. We also show the Sabertooth 55i having a 2+ ns improvement over the X58 on Access Times.
SiSoftware Sandra
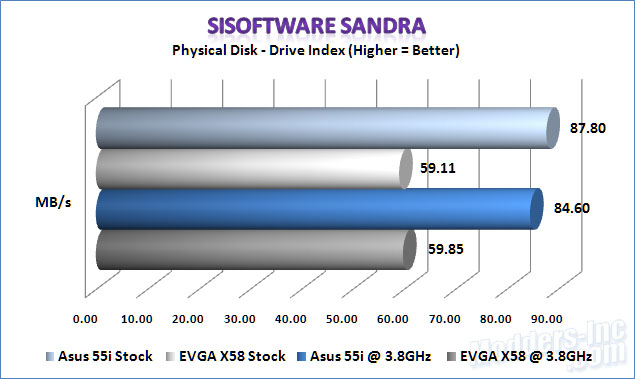 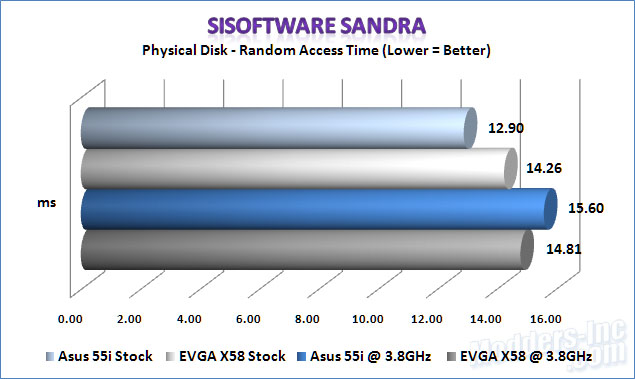
We then ran SiSoftware Sandra’s Physical Disk test.We show a 25+ MB advantage on the Sabertooth 55i configuration again, but did see a spike in the Access Time with the Sabertooth 55i overclocked to 3.8 GHz.
Multi-Media Encoding Performance:
SiSoftware Sandra
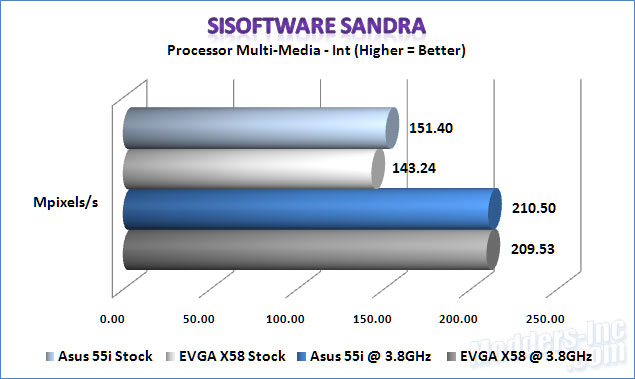 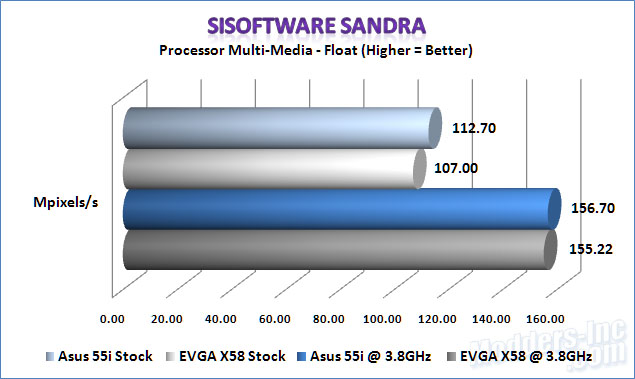
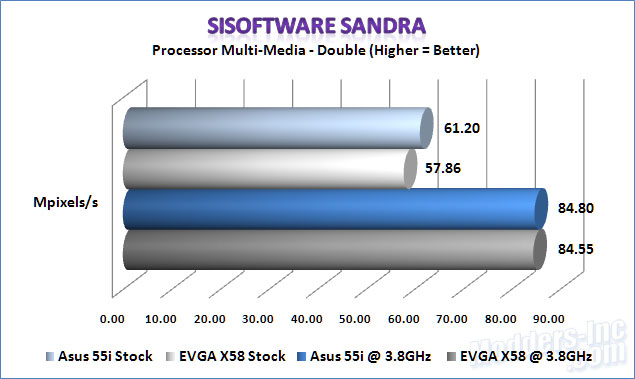
Next up we wanted to test the encoding performance of both configurations. Using SiSoftware Sandra again, we see that the Sabertooth 55i nudged the X58 out by a small margin in all three tests. 7-Zip
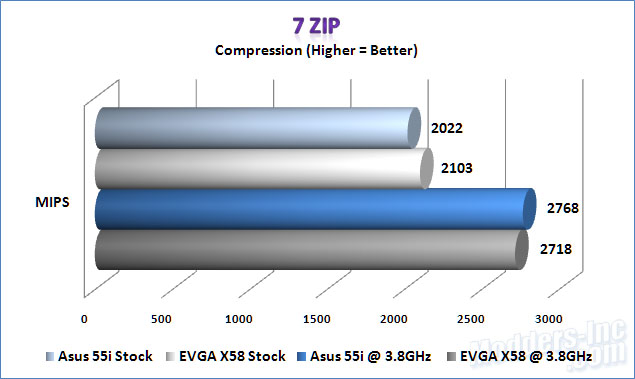 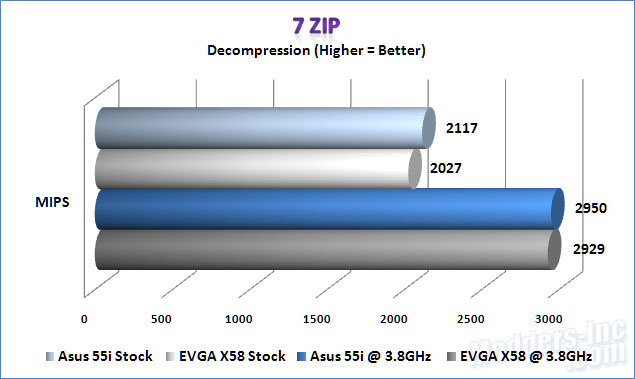
Using 7-Zips integrated benchmark to test the compression and decompression of files. On the average, the Sabertooth 55i showed us again that it was more than capable of taking the lead and running with it.
Synthetic 3D Performance:
3DMark 06 & Vantage
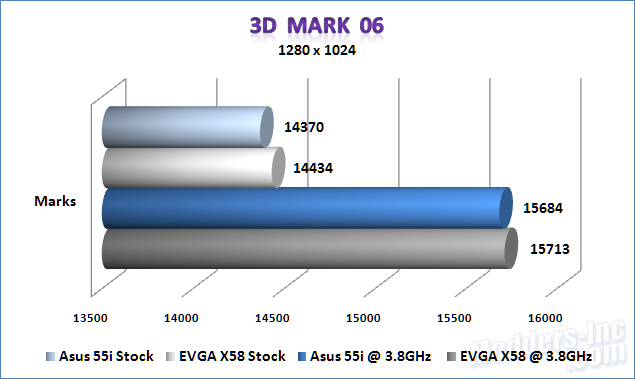 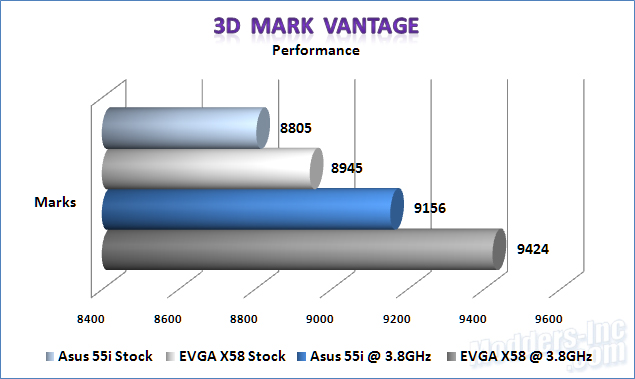
Moving on to our synthetic tests. We ran 3DMark 06 at its default settings with a resolution of 1280×1024 and then ran 3DMark Vantage at the Performance settings. We ran each application a total of three times and averaged the results for our charts. The end result is the X58 lead by a small margin in both tests.
Cinebench 11.5 64bit
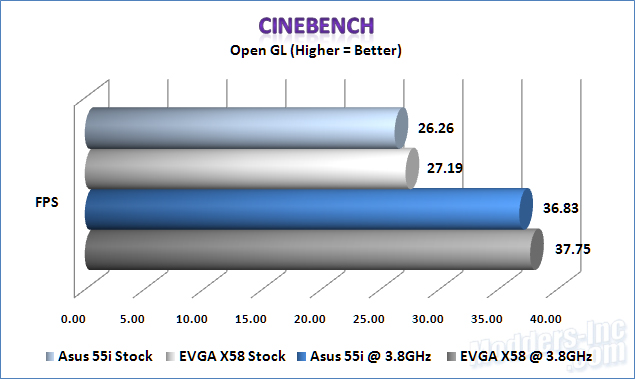
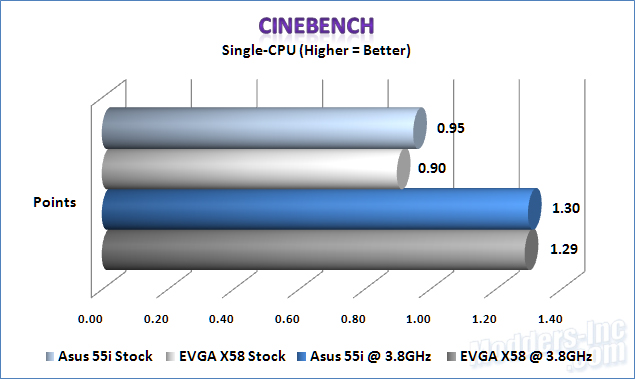
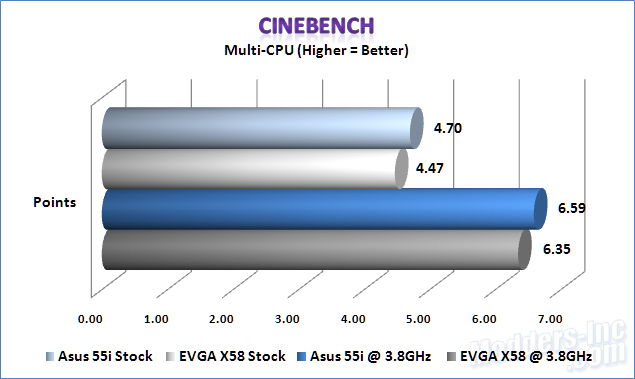
We then moved onto Cinebench 11.5. As we can see by the first chart, the Open GL tests seemed to favor the X58 configurations while the Sabertooth 55i pulled ahead in the Single and Multi-CoreCPU tests.
POV-Ray 3.7
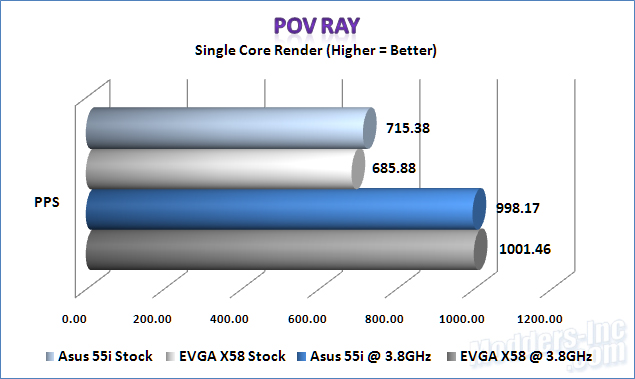 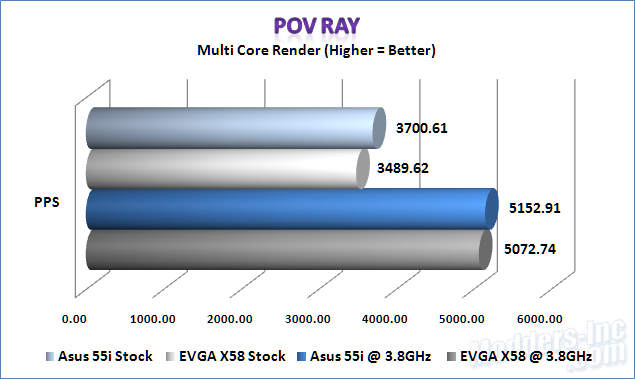
Closing up the synthetic testing, POV-Ray shows the overall average going to the Sabertooth in most of the tests. With results as close as we are seeing with these two configurations, it’s really hard to side either way.
Gaming Performance:
Crysis 1.2
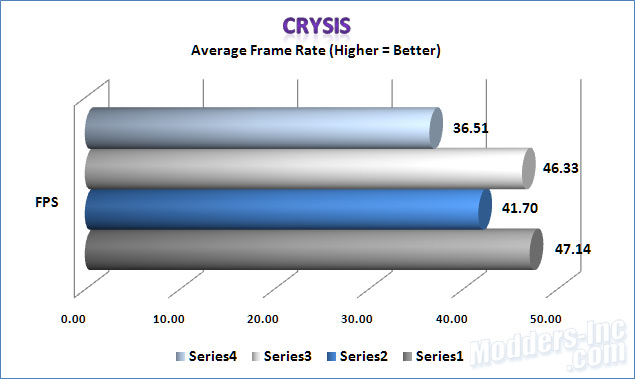
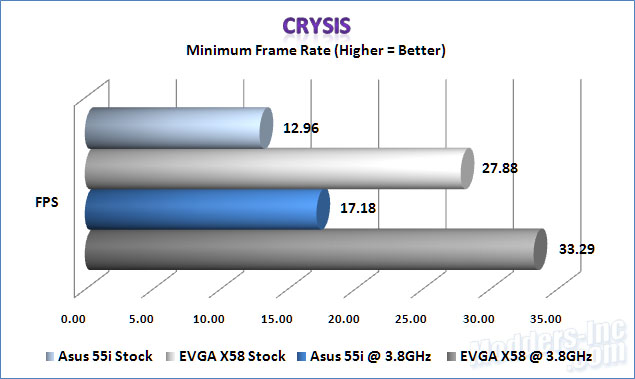
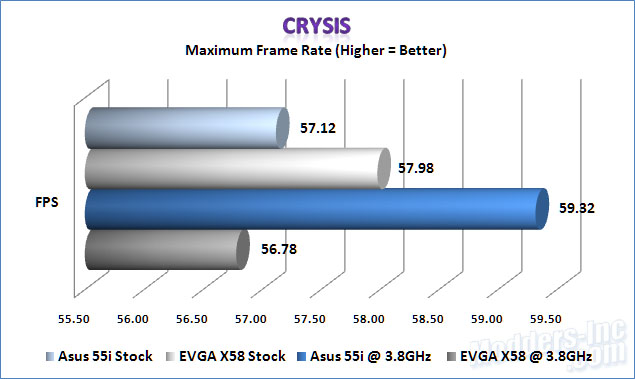
We decided to start the gaming performance off with Crysis 1.2. Using the Crysis benchmark we ran the configurations through the same test at the 1280 x 1024 configuration with everything set to High and Direct X 10 enabled. Looking at the Average FPS we see a difference of 7 ~ 10 FPS leaving the X58 with the slight advantage. Granted that it’s not much of an advantage, but if you look at the minimum FPS you will see that it jumps to 15 ~ 16 FPS.
Dirt 2
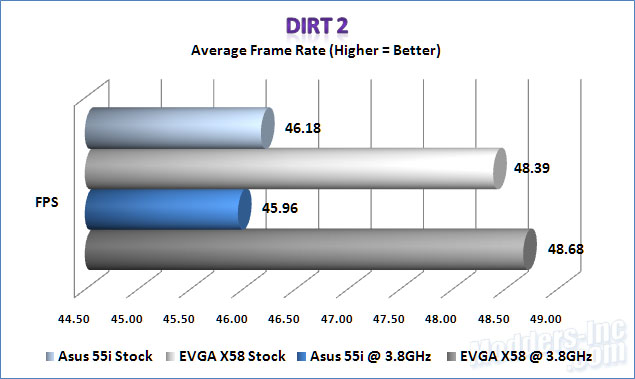 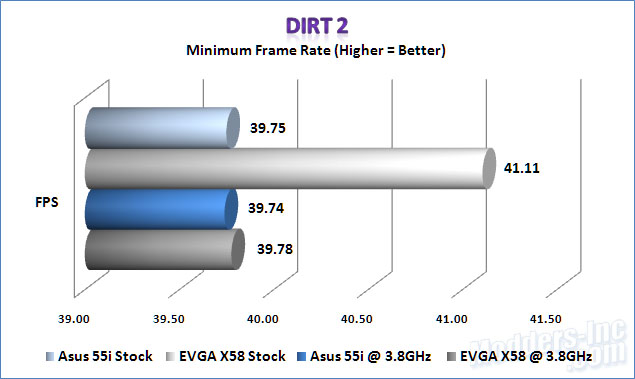 
Things get a lot tighter when we pull in a current game, Dirt 2. With the differences only being a few FPS apart, there really isn’t enough to boast in either direction.
FarCry 2
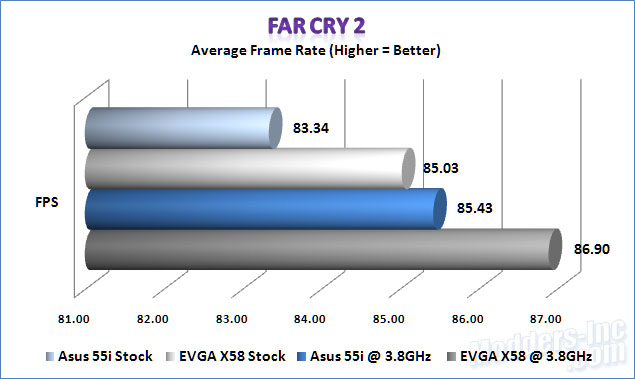
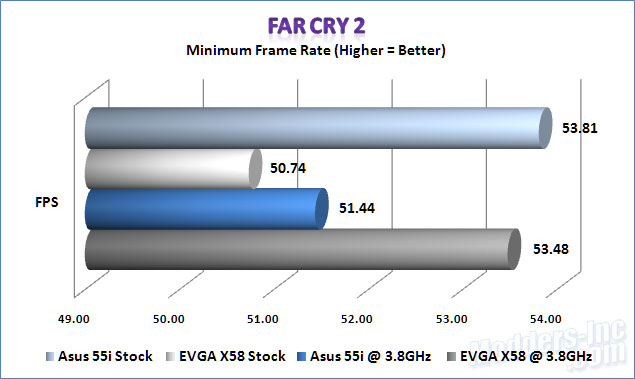
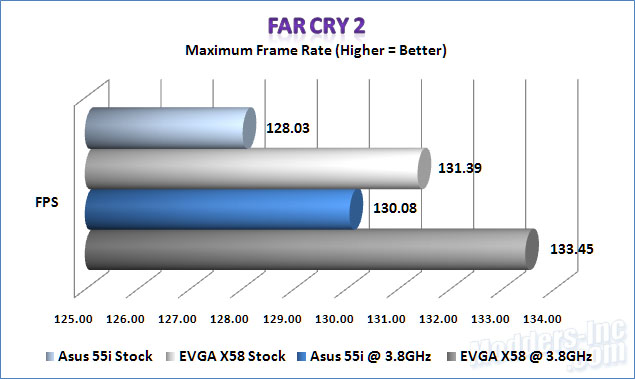
FarCry 2 showed roughly the same results as the Dirt 2 results. We show an average of roughly 3 FPS in favor of the X58 configuration. This small of a difference isn’t going to make the least little bit of change in performance from one system to the other.
|
