ASUS P7H55D-M Evo LGA1156 Motherboard
Observation |
|
Overclocking:
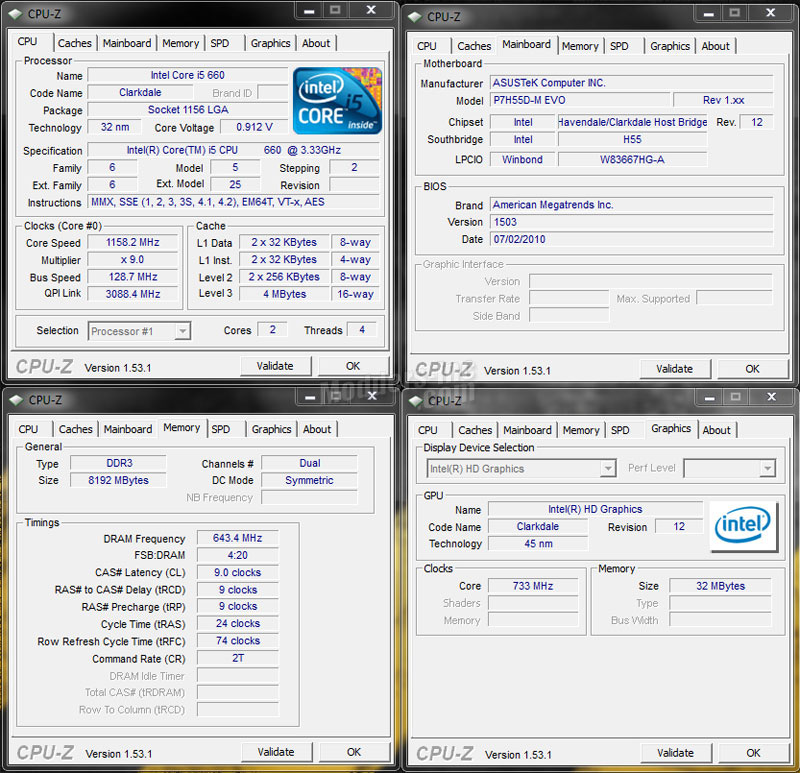 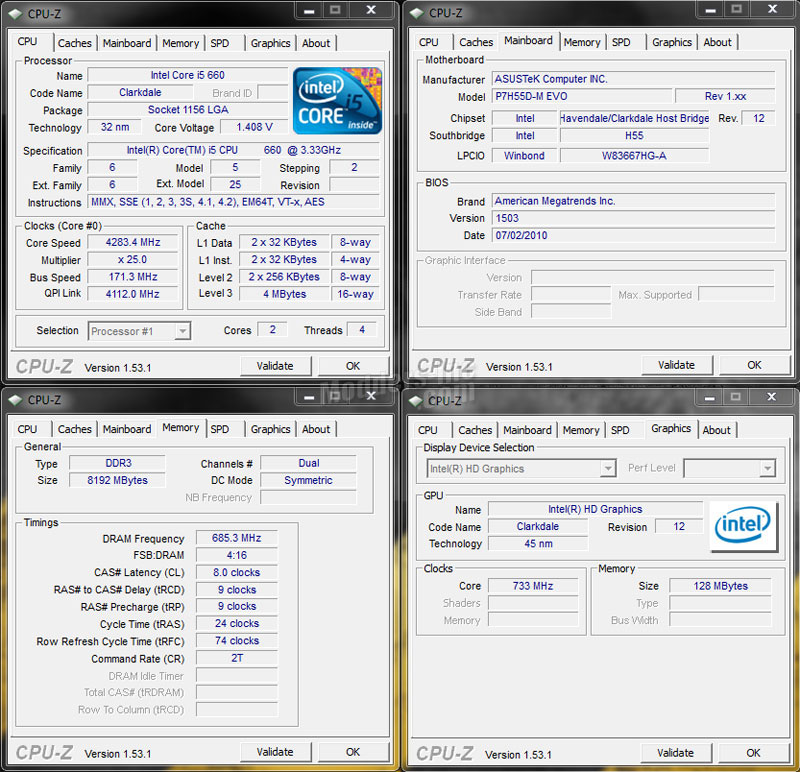
Overclocking on the Asus P7H55D-M Evo is basically the same as the P55’s. You still have all the same basic options via the bios to manipulate just about everything you could want. As we can see by the first set of CPU-Z screenshots, I started off with the system at its default levels and the current BIOS version. Using an Intel Clarkdale Core I5 660 CPU gave me another boundary to watch. With the Integrated Graphics on the CPU, when overclocking the CPU you’re also going to be overclocking the iGPU. I soon found out that the iGPU on my Core I5 660 doesn’t like being adjust to much above its stock levels. I ended having to back it down from 733 MHz to 633 MHz then I was able to start playing with the CPU’s BCLK a bit more. I ended up getting it to run at 4283.4 MHz with a multiplier of 25. I’ve seen where the guys running the Core I5 661 have had much better experiences with Overclocking.
So before moving on to the rest of the testing, I wanted to get my Stock setup and my Overclocked setup dialed in.
Power Consumption:
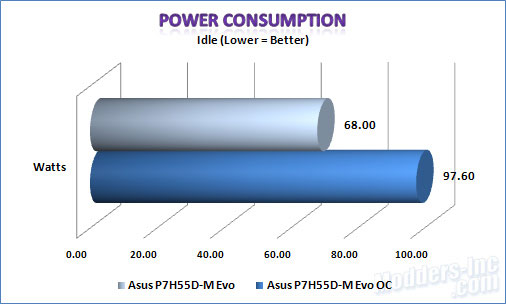 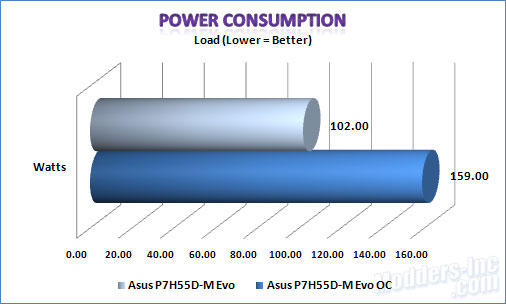
To measure the power consumption of the system I used a Brand Electronics Model 20-1850 Power Meter, which should be a little more accurate than the typical Kill-A-Watt meter. Loading the system was done with PC Mark, I simply ran a full test and pulled the peak power value from the Brand 20-1850 Power Meter. Looking at the charts we can see I pulled an ideal of 68 Watts on the stock settings, and an idle of 97.6 Watts on the overclocked settings. That’s just over 43% increase on the idle side going from 3.3 GHz to 4.2 GHz. On the load side we achieved a maximum load of 102 Watts on the stock configuration, and a maximum of 159 Watts overclocked. This time we achieved a 55% increase in power consumption for the overclocked configuration.
EPU-6 Engine Results: 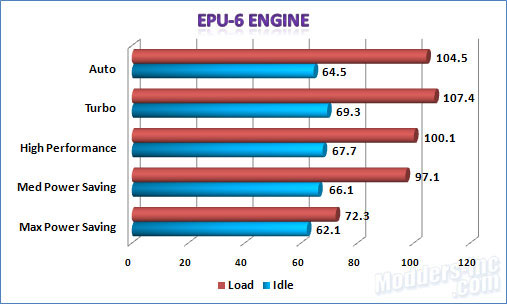
After completing all the testing I decided to see just how much of a difference the different modes in EPU-6 Engine would affect the total power consumption of the system. In order to do this I had to go back to default settings to start with. EPU-6 Engine will not start if you have already got the system overclocked via the BIOS or Turbo V. To do the load testing for this phase I decided to use Everest Ultimate’s System Stability Test. As we can see by the above chart, the Maximum Power Saving Mode did give us the least amount of power used. We did manage to get pretty close on the idle measurement with the Auto Power Saving mode. Altering the settings in EPU-6 Engine is obviously going to affect things. You can still tweak the overclock or underclock for the modes but you will not have quite the control you would get with doing it in the BIOS.
CPU Performance:
PC Mark Vantage:
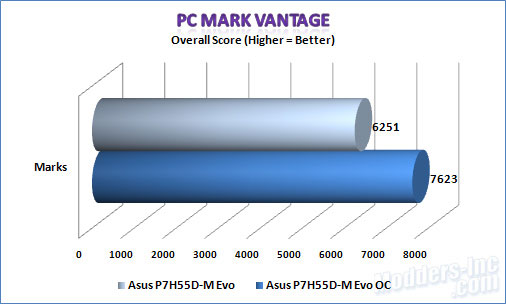 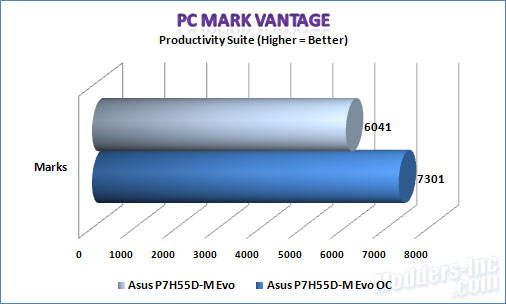
PC Mark Vantage is a PC benchmark suite for PC’s running Windows Vista (32 or 64bit) or Windows 7 (32 or 64bit) OS’s. PC Mark Vantage measures your computer’s performance across a wide variety of common tasks such as viewing and editing photos, video, music and other media, gaming, communications, productivity and security. Choosing to run the Intel Core I5 660 on the Asus P7H55D-M Evo, I was aiming the testing toward a HTPC build. Overclocking the Core I5 660 to 4.2 GHz yielded me a 27% overclock while giving me a 21% increase on the Overall score in PC Mark Vantage.
SiSoftware Sandra:
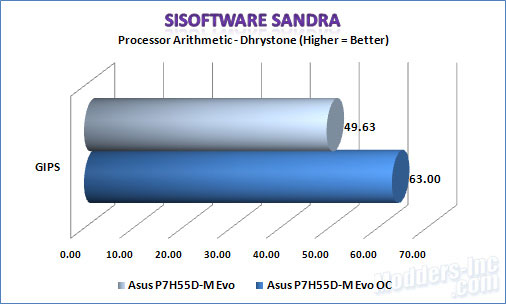 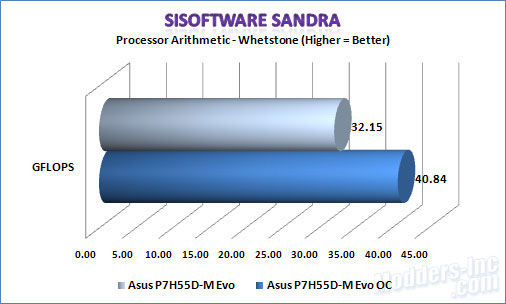
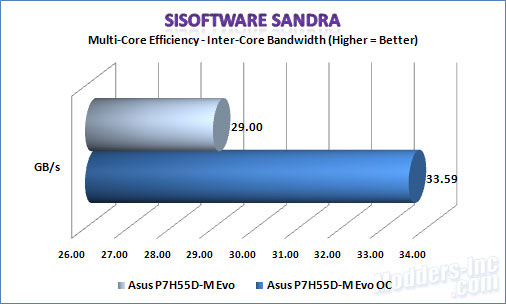 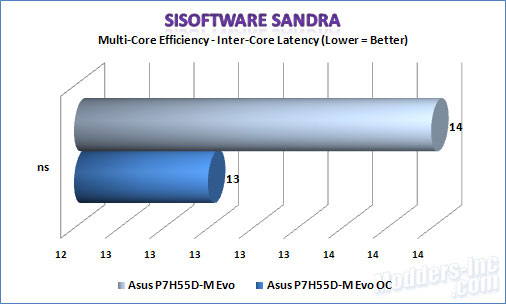
Is SiSoftware Sandra’s Processor Arithmetic I was able to achieve a 26% gain and a gain of 15% on the Multi-Core Efficiency test. Hover the Latency did drop by 1 ns on the overclocked setting. I bet no one is going to notice that 1 ns, Right?
Super Pi:
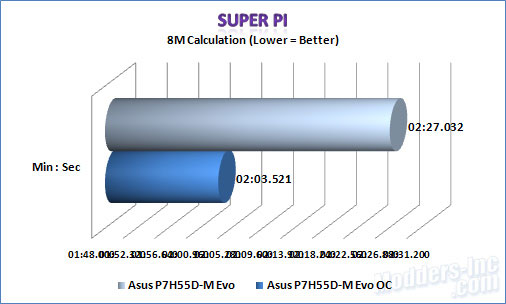 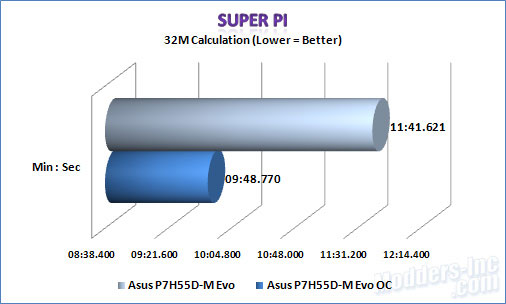
On the number crunching side of things. We Super-Pi’s 8M and 32M calculations. The stock setup on the P7H55D-M Evo did a good job coming in at 2 minutes and 27 seconds, while the overclocked configuration shaved off roughly 24 seconds of that time. On the 32M calculation we seen almost a 2 minute difference between the stock and overclocked settings.
Memory Performance:
PC Mark Vantage:
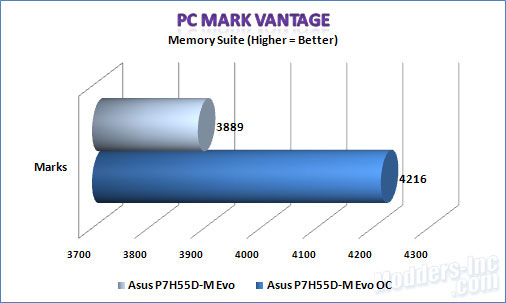
Back in PC Mark Vantage for the memory testing. We see above that we achieved a respectable 3889 Marks on the stock run and achieved roughly an 8% improvement with the overclocked settings.
SiSoftware Sandra:
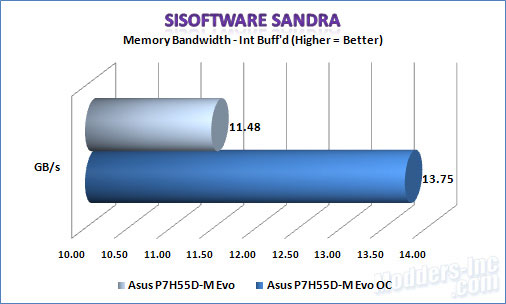 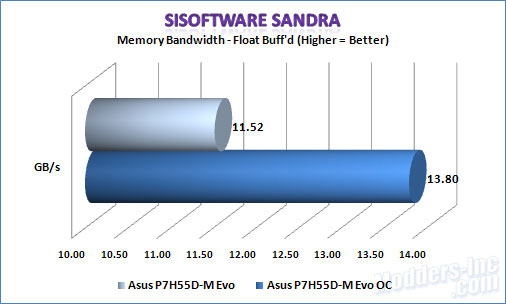 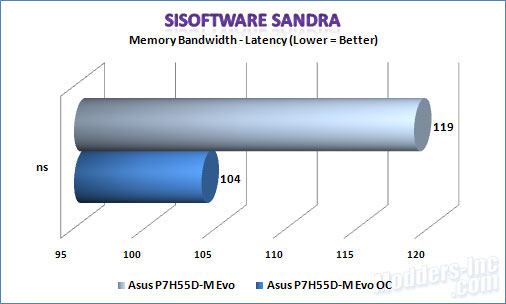
In SiSoftware Sandra, we see almost a 20% difference on the Int Buff and Float Buff Bandwidth tests while we have the latency improving by roughly 14%.
Everest Ultimate:
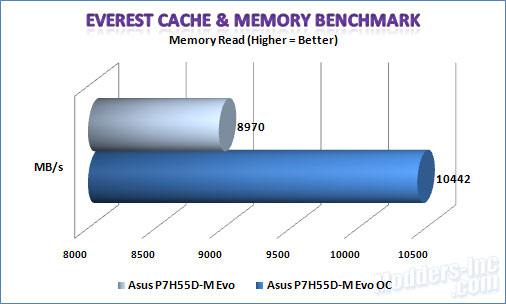 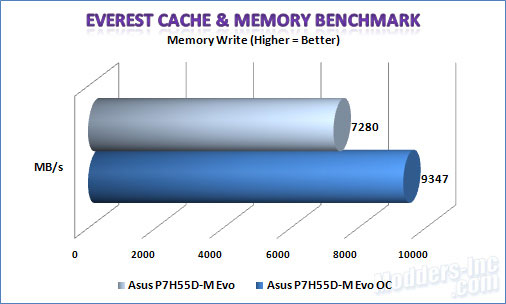 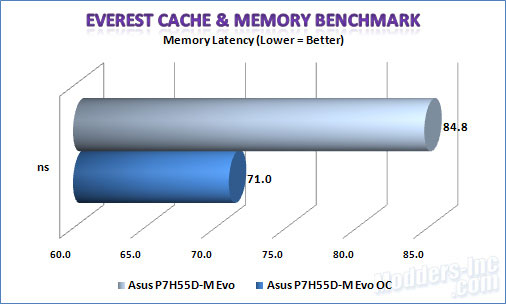
In Everest Ultimate we see a difference of roughly 16% on the Read test but get a 28% improvement on the Write test. We also see roughly a 20% faster latency with the overclocked settings.
Hard Drive Performance:
SiSoftware Sandra:
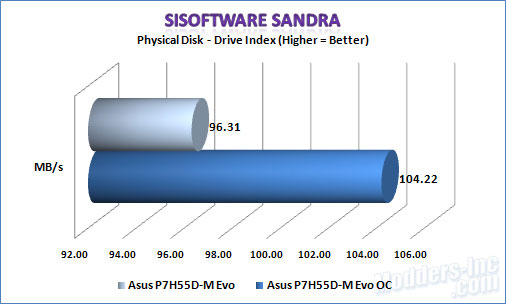 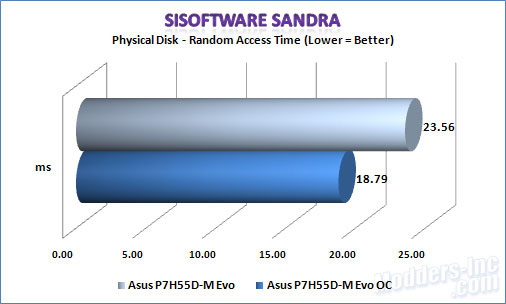
Moving on to the hard drive test, first up we have SiSoftware Sandra’s Physical Disk tests. The Hitachi drive provides us with 96.31 MB per second at stock settings and improves by 8% to 104.22 MB per second with the overclocked settings. We also dropped the random access time by almost 5 ms.
HD Tune:
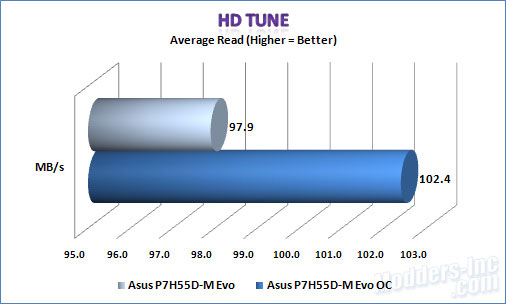 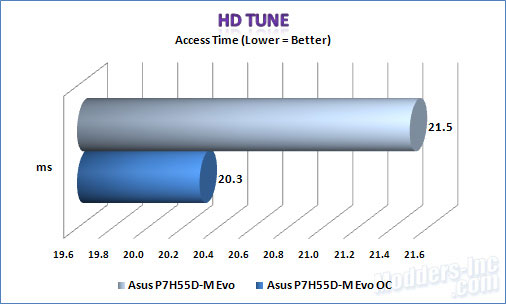 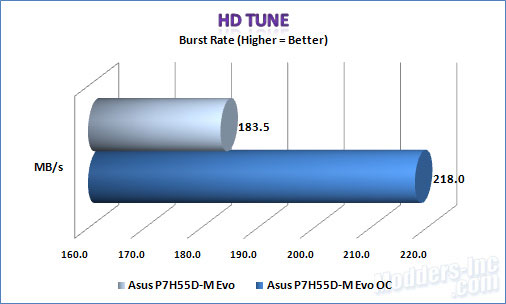
In HD Tune we don’t see quite as much improvement on the average read speeds coming in at a difference of 4%. The access times are also closer showing us a difference of only 1.2 ms. On the burst rate test though, we achieved a 18% improvement with the overclocked settings.
Multi-Media Performance:
PC Mark Vantage:
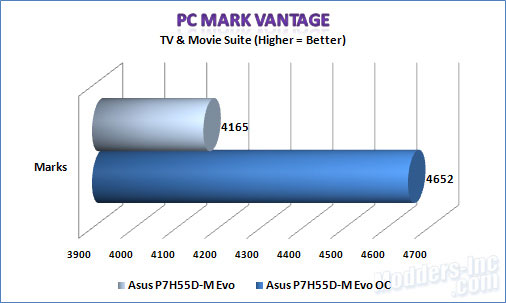 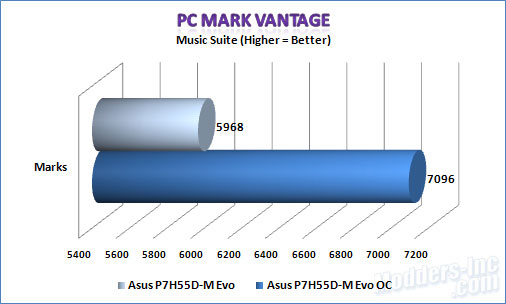
In PC Mark Vantage’s TV & Movie Suite, the P7H55D-M Evo gave us a respectable score of 4165, while achieving 4652 with the overclocked setup giving us an 11% improvement. On the Music Suite we managed to improve it by just under 19%.
SiSoftware Sandra:
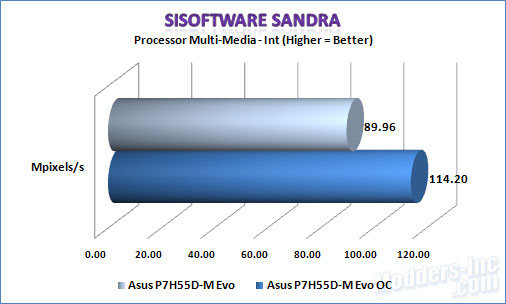 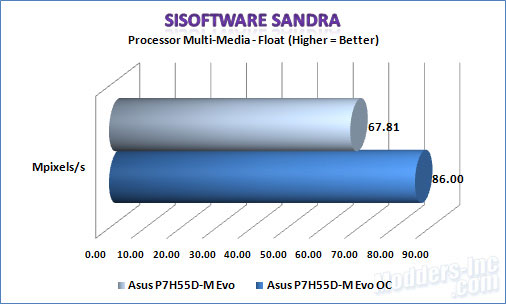 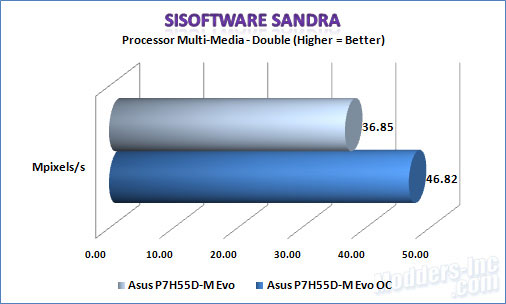
In SiSoftware Sandra’s Processor Multi-Media tests we managed to average a 26% improvement across the board.
Synthetic 3D Performance:
Cinebench:
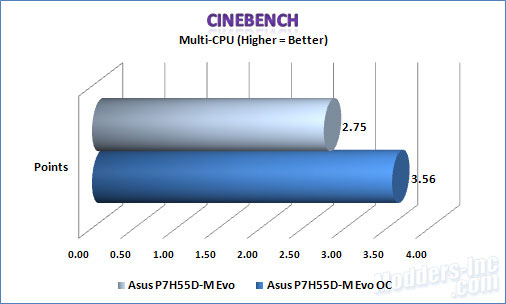 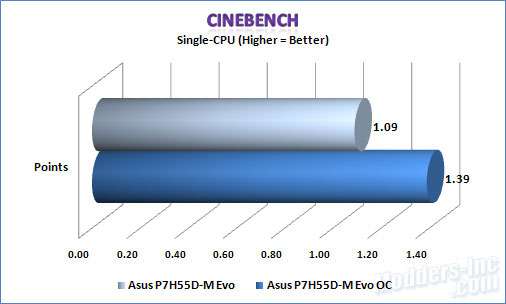
Although we are dealing with the Integrated GPU on the Core I5 660, I didn’t feel that doing any actual gaming tests would fair to well. I did decide to go ahead and run Cinebench 11.5 followed up with POV-Ray. As we can see by the above charts, the overclocked setup averaged a 28% improvement. I actually thought this might have went the other way seeing how I had to back down the iGPU’s frequency to achieve the 4.2 GHz overclock.
POV-Ray:
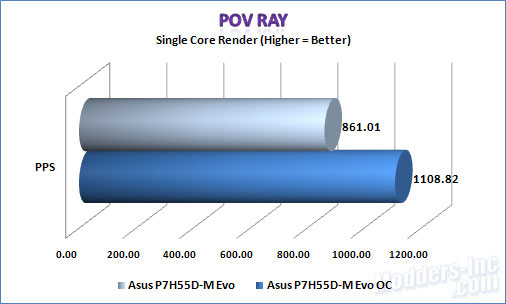 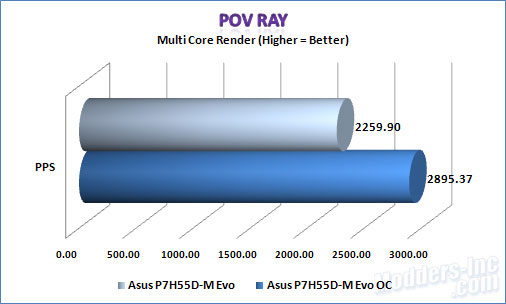
POV-Ray gives us much the same as the Cinebench tests did. Again, I would have swore that slowing down the IGPU was going to cause the numbers to go the other way. I guess I will have to stick with the numbers rather than my thoughts.
USB 2.0 vs. USB 3.0 Performance:
With the Asus P7H55D-M Evo having true USB 3.0 support, I had to do some testing between it and USB 2.0. Although I knew I wasn’t ideally setup for it, but I decided to reach out and get my hands on a USB 3.0 drive enclosure. Our friends at Geeks.com hooked me up with a USB 3.0 Kit that included a USB 3.0 drive enclosure, a USB 3.0 Express Card, a USB 3.0 Cable, and a Samsung 500GB 5400RPM 8M hard drive. Sure a faster drive would gives us a better grasp of the gains that could be had, but we are thankful for their generosity.
SiSoftware Sandra:
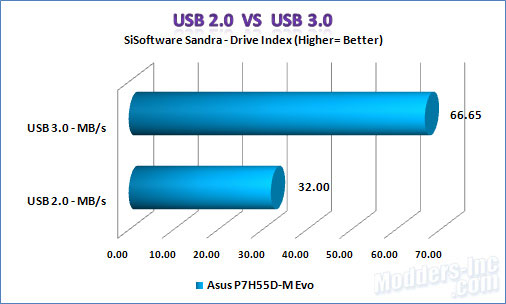 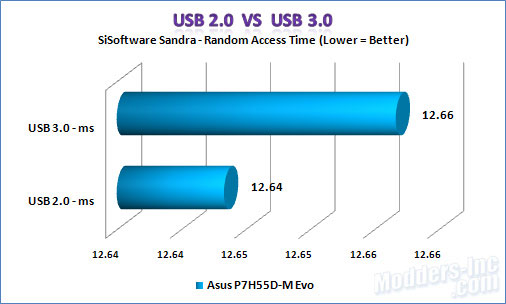
First out of the box was SiSoftware Sandra. On the Drive Index test we achieved a whopping 108% improvement going from USB 2.0 to USB 3.0, while the access time was within 0.01 ms’s of each other. Over a 100% improvement on a 5400 RPM drive. Just imagine what you would get with a faster drive!
HD Tune:
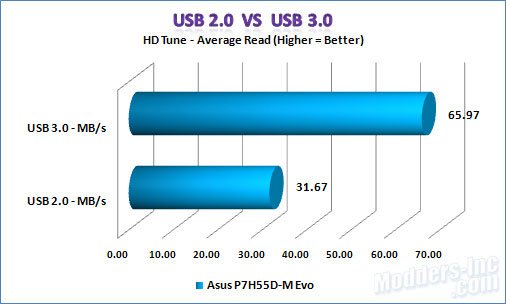 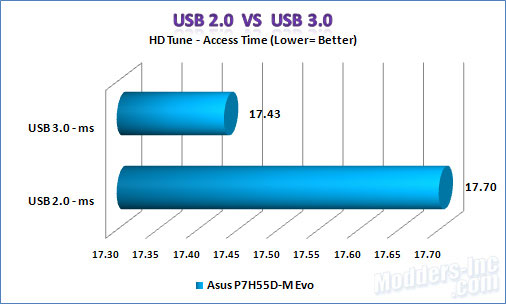 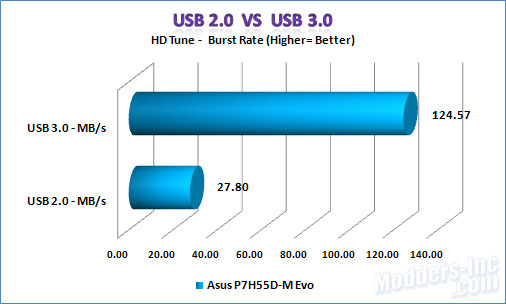 Moving on to HD Tune again we achieve just over 108% on the average read speed of the Samsung drive. Our access times are pretty close again with a difference of only 0.27 ms’s. Looking at the burst rate results… Holy Crap…. That’s an improvement of roughly 350%.. WOW, is about all I can say to that. |
