Sub System Benchmarks (Storage, Audio and Networking)
Storage Benchmarks
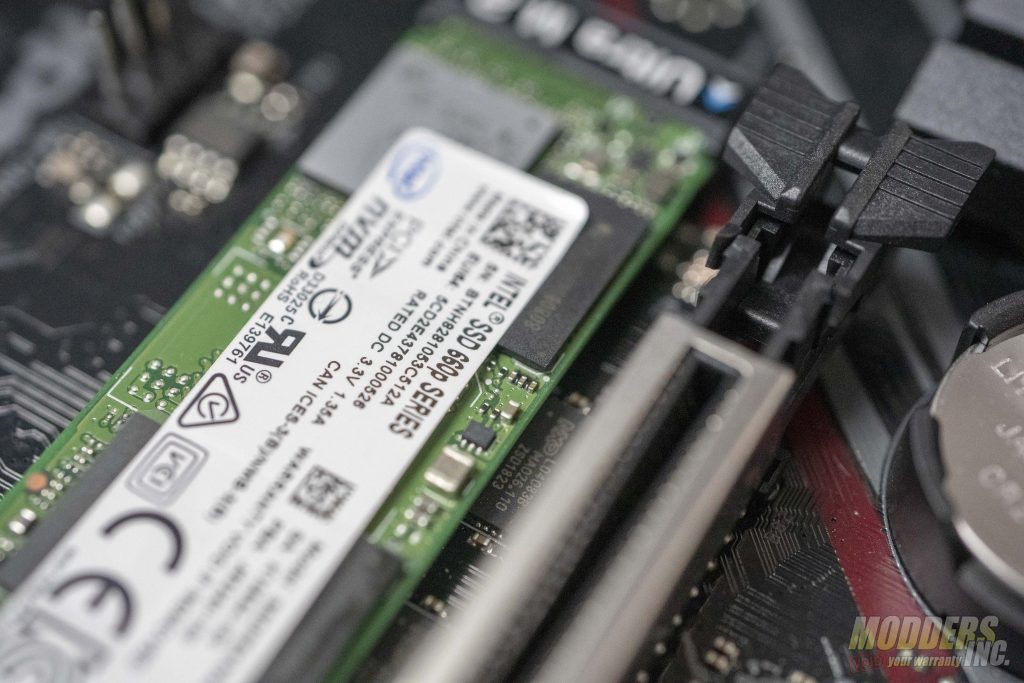
For Storage benchmarks, We used two different benchmarks. The first being the ATTO Disk Benchmark. The other is CrystalDiskMark5. ATTO and CrystalDisk Mark were used to test two drives. We tested both an NVMe M.2 and a 2.5″ SATA 6 SSD. The first drive we tested was the 512 GB variant of the Intel SSD 6 660p NVMe M.2. This was the first M.2 SSD to use Micron’s 3D NAND technology. The SATA drive we tested was the 960 GB Crucial BX500. We recently did a review of this drive which can be viewed here: https://www.modders-inc.com/crucial-bx500-960-gb-ssd-review/
ATTO Disk Benchmark
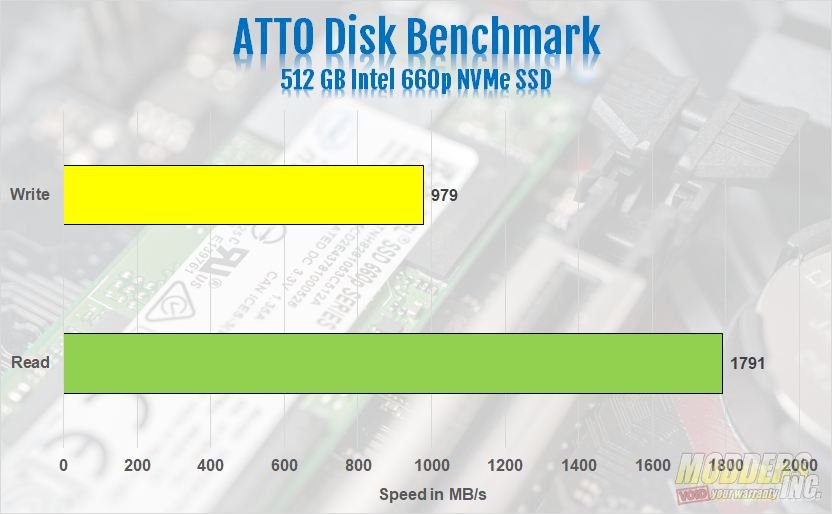
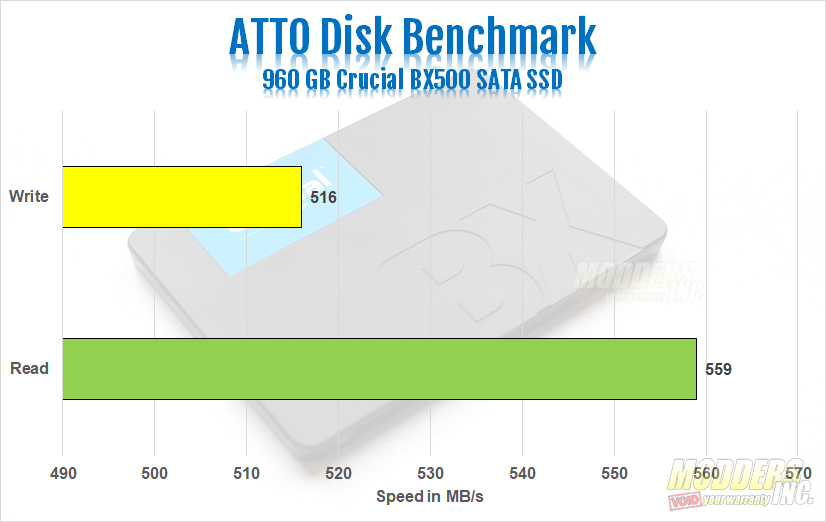
The ATTO Disk Benchmark utility was designed to measure regular disk drive performance. However, its more than capable of measuring both USB flash drive and SSD speeds as well. The utility measures disk performance rates for various sizes of files and displays the results in a bar chart showing read and write speeds at each file size. The results are displayed in megabytes per second. The Intel SSD 6 660p achieved 1791 MB/s on the read speed and 979 MB/s on the write speed. This is just about where it’s advertised to run at. The BX500 hit a max of about 559 MB/s on the read speed and a max of about 516 MB/s on the write speeds, almost saturating the SATA 6 interface.
CrystalDiskMark 5
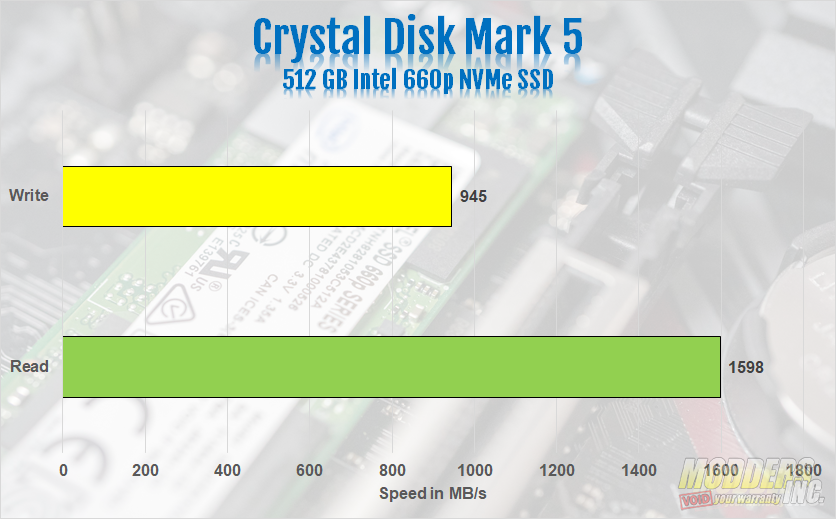
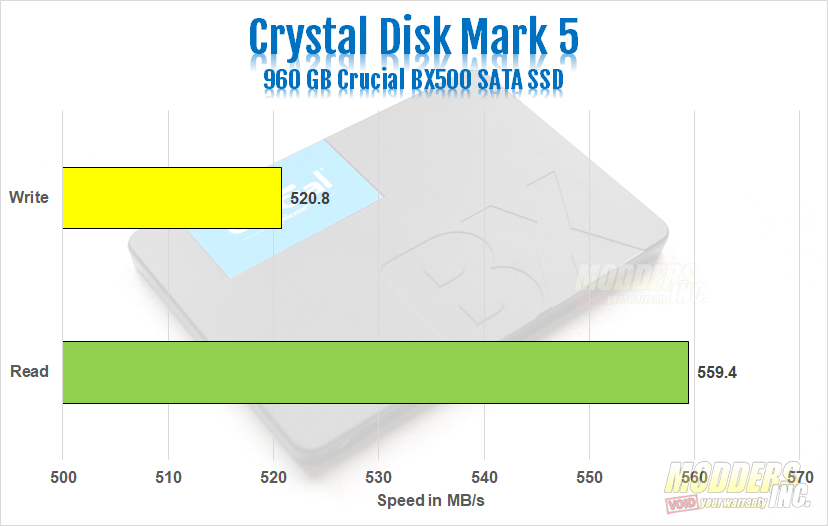
“CrystalDiskMark 5 is designed to quickly test the performance of your hard drives. Currently, the program allows to measure sequential and random read/write speeds.” It’s one of the most commonly used utilities for testing drives. Both the Intel 660p and BX500 did better on Crystal Disk Mark 5. The Intel 660p hit 1598 MB/s on the read speed and 945 on the write speeds. This is a bit lower than the advertised speeds of 1700 MB/s on the read and 1000 MB/s on the write. The BX 500 did much better in Crystal Disk Mark 5 than it did on ATTO. The BX500 hit 559.42 MB/s on the read and 520.8 on the write speeds.
Audio Testing
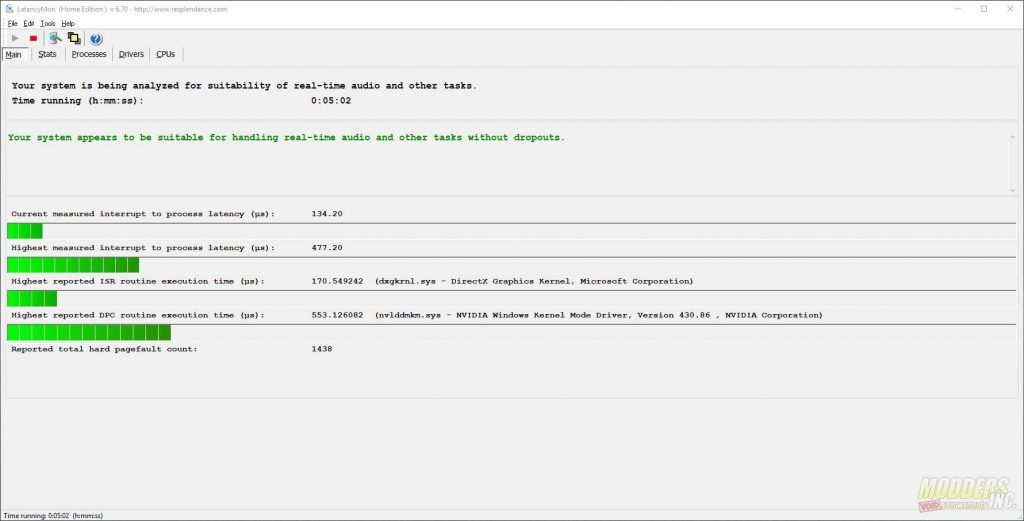
To test the onboard audio on the Z390 Phantom Gaming SLI/ac, we use the Rightmark Audio Analyzer benchmark. However, before we run the benchmark, we must test the DPC, or Deferred Procedure Call latency. The DPC is checked to ensure the audio can produce useable results in Rightmark. DPC, or Deferred Procedure Call latency, is a Windows function that handles driver efficiency and allows high-priority tasks to defer required, but lower-priority tasks for later execution. We use LatencyMon to test the DPC Latency.
We had LatencyMon run for a little over 5 minutes. The highest reported ISR routine execution time was 170.55. The highest reported DCP routine execution was 553.13. This is higher than I’ve seen in previous reviews but still acceptable. At the 4000 microseconds, the system will be unsuitable for real-time audio playback. Since both results were under this range, we can continue to Rightmark Audio Analyzer.
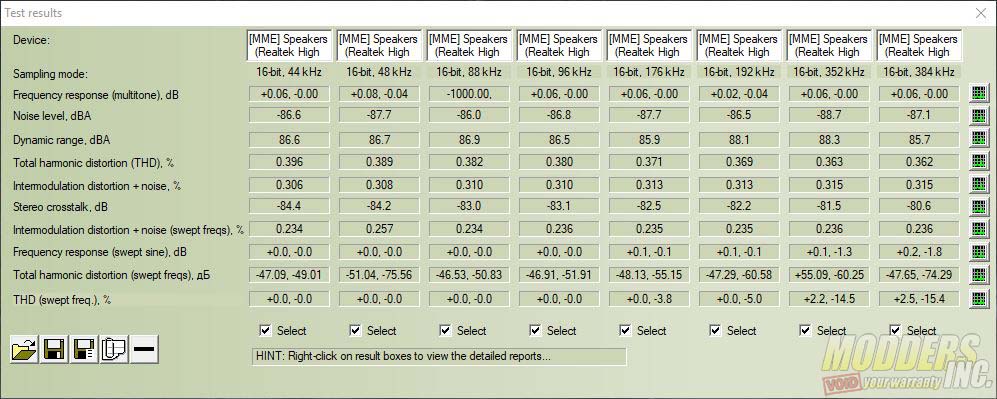
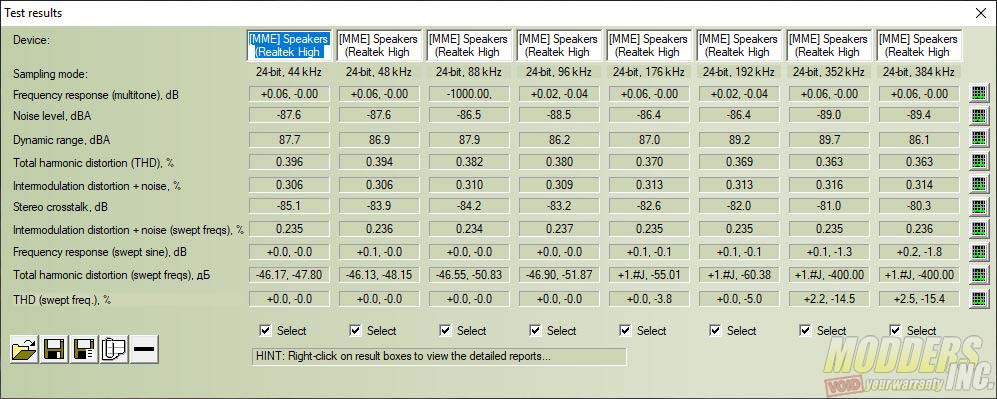
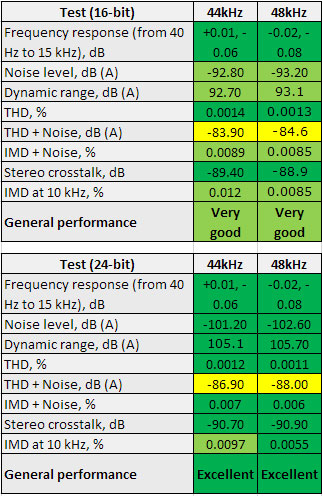
To test with Rightmark, you must first plug into both the rear headphone jack and the rear mic jack using a double-ended 3.5 mm jack cable. This creates an audio loop to test the internal audio performance of the onboard audio. We tested using both 16 and 24-bit settings through a range of frequencies from 44 kHz up to 192 kHz. On both the 16 and 24 bit testing, the Z390 Phantom Gaming SLI/ac had acceptable results. The chart below is to give an idea of what very good and excellent results for the Rightmark benchmark look like. The Phantom Gaming SLI/ac slotted in just below the Very Good results. Given these are just numbers in a benchmark. The On-board audio on the Phantom Gaming SLI/ac actually sounded very good.
Network Testing
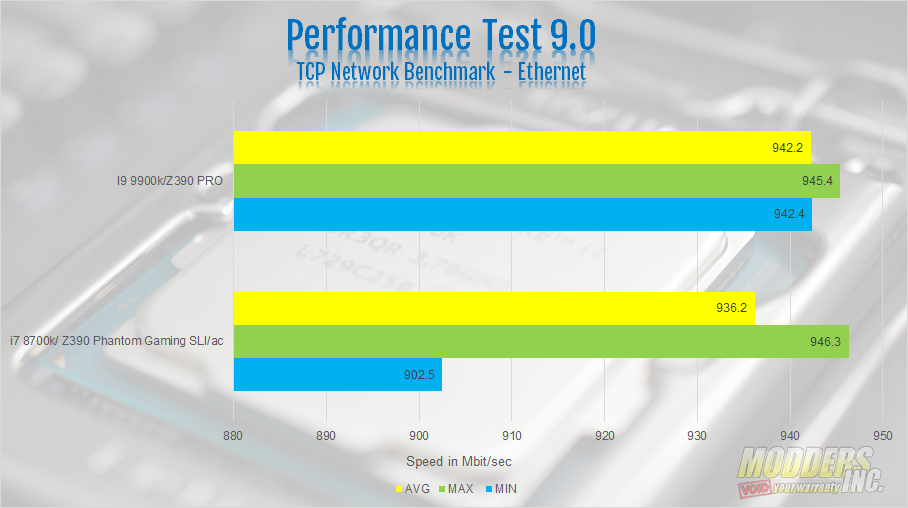
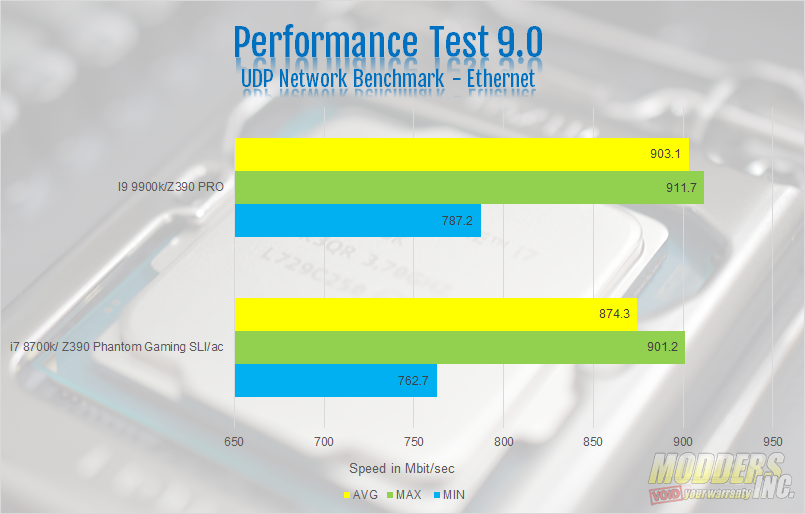
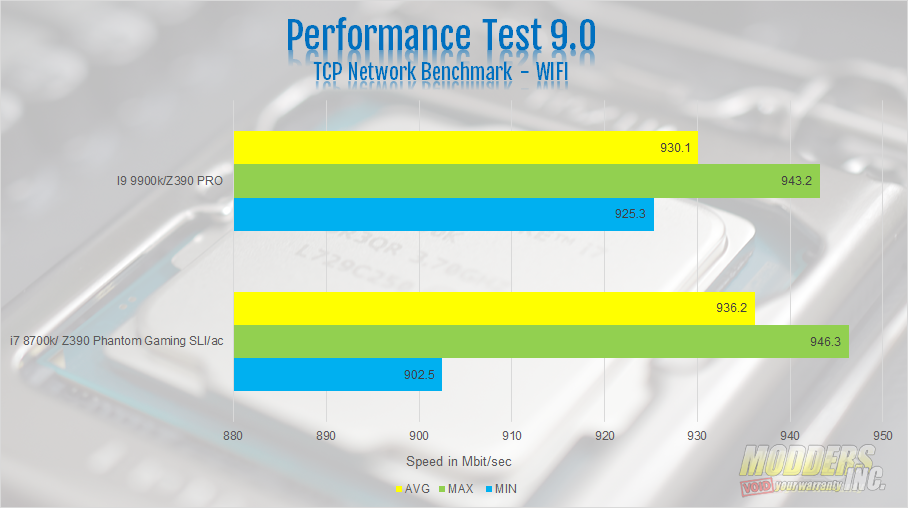
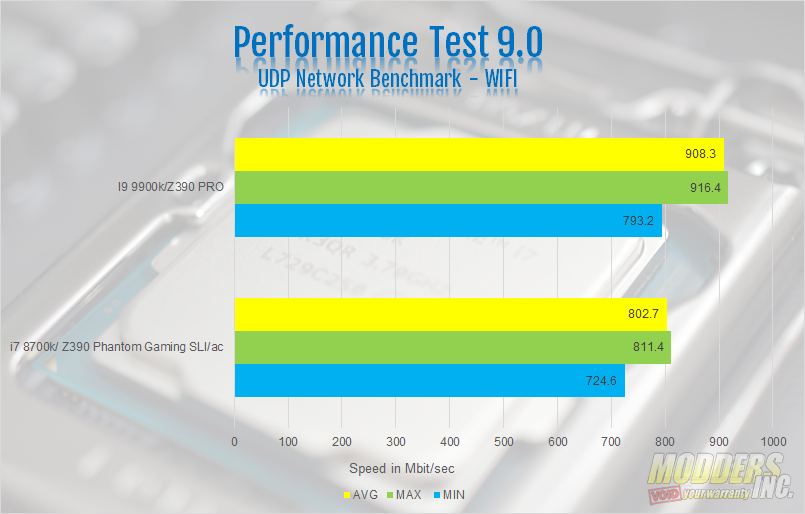
For network testing, I used my Comcast Business class router from Motorola. The server PC was my standard test bench. This server PC consists of an I7 8700k on the Z390 Phantom Gaming SLI/ac, the Client PC was the Z390 Pro running an I9-9900k. This was the one test we ran where the 9900k was used. This is due to the fact the networking test requires two systems each running the Performance Test 9 networking test simultaneously. The system We use the Networking Test in the PassMark Performance Test 9. For this review, we ran both the TCP and UDP Networking tests. Both tests were run on WiFi and Ethernet. As the charts show, the Z390 Phantom Gaming SLI/ac did outperform the Z390 pro on the networking test.
The results for both the Z390 Pro and the Phantom Gaming SLI AC were very similar. However, the Phantom Gaming SLI ac achieved better results on the TCP test on both Ethernet and over WIFI. The Z390 Pro achieved better results on the UDP Test both over WiFi and hard-wired through Ethernet.
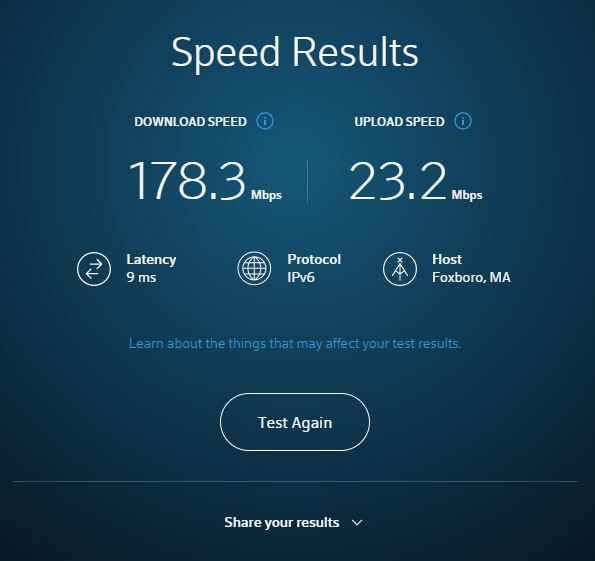
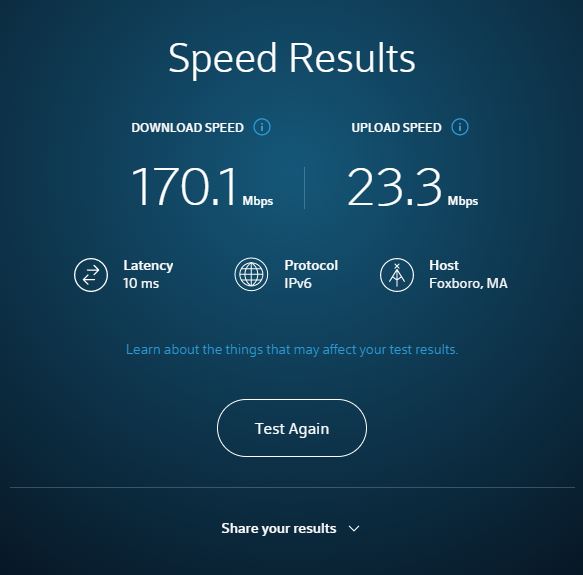
Since this motherboard has 802.11 ac WIFI, it wouldn’t be a full review if we didn’t run a speed check on the WIFI. My office has Comcast Business class internet. The plan is 150 Mbps download by 30 Mbps upload. The 802.11 ac WIFI on the Z390 Phantom Gaming SLI/ac hit 170.1 Mbps download and 23.3 Mbps upload. Through Ethernet, the speeds test results were 178.3 Mbps download and 23.2 Mbps upload. The WIFI on the Z390 Phantom Gaming SLI/ac isn’t far off from the results through Ethernet. However, depending on your internet connection, results will vary. The WIFI on this board is more than suitable for gaming, streaming or uploading to YouTube. The limit is going to be your connection to the internet.
