General Performance Benchmarks.
AIDA64 ENGINEER
AIDA64 has a set of several 64-bit benchmarks to measure how fast the computer performs various data processing tasks and mathematical calculations. Multi-threaded memory and cache benchmarks are available to analyze system RAM bandwidth and latency. Benchmark pages of AIDA64 Extreme provide several methods to measure system performance. These benchmarks are synthetic, so their results show only the theoretical maximum performance of the system. The AIDA64 suite has various benchmarks for CPU, FPU, GPU, storage and memory testing.
Memory Testing
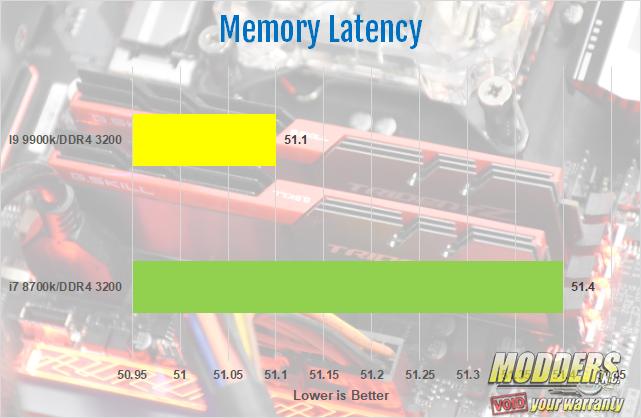
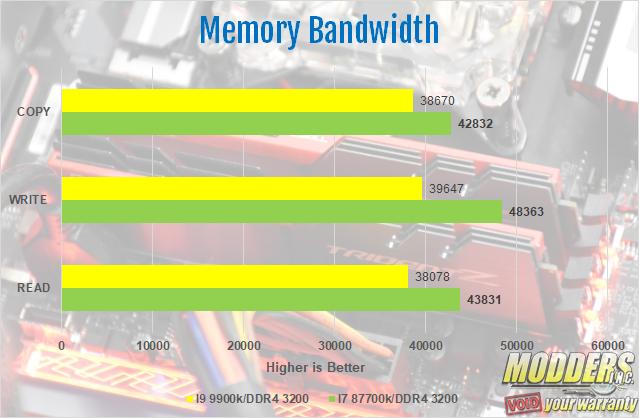
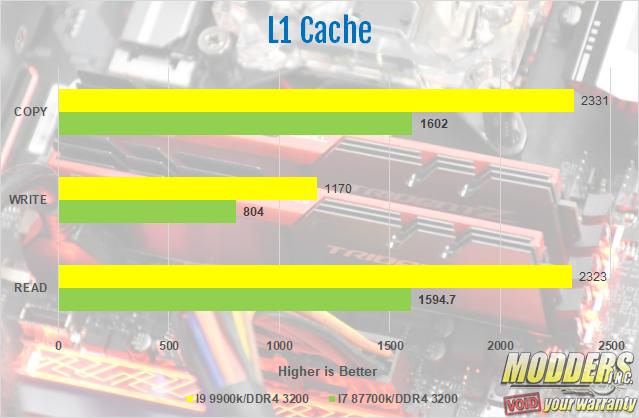
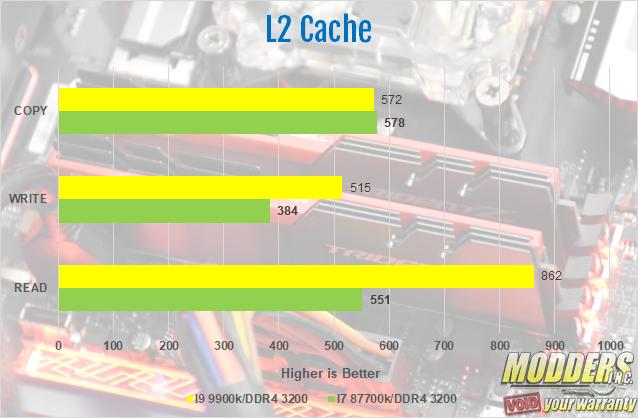
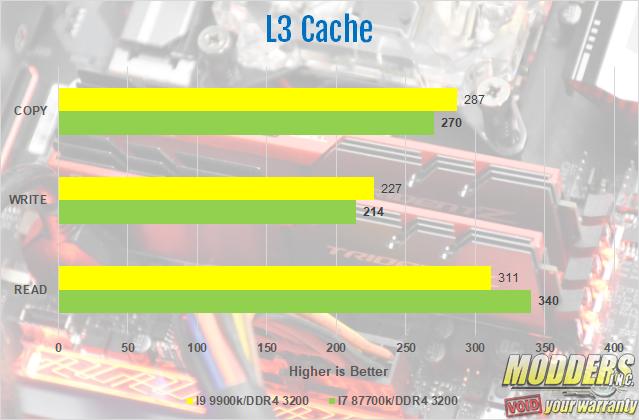
The memory I used for testing is a 64 GB, or 4 x 16 GB kit of G. Skill Trident Z 3200 MHz, CAS 14. I usually take out half the memory for testing. However, I forget to and only remembered more than ¾ the way through testing. That’s the only reason I used 64 GB of memory for testing. In the future, I’ll have a 16 gb kit specifically for reviews. This is due to the fact that most people won’t use more than 16 gb in the average system. The first part of the AIDA64 memory test is the latency test. The latency is measured in nanoseconds. With X.M.P profile #1 enabled, I had several issues. The least of which was my CPU phantom throttling. However, with XMP Profile #2 enabled, the system runs great. So, with XMP profile 1 set and the memory running at 3200 MHz, the latency was 51.1 nanoseconds. On the memory bandwidth test, the G. Skill Trident Z kit I used scored 38078 on the read, 39647 on the write and 38670 on the copy. I found these results a bit odd since the 9900k and 8700k used the same exact memory for this testing. For the L1, L2 and L3 cache, the read, write and copy are on the charts below.
CPU Testing
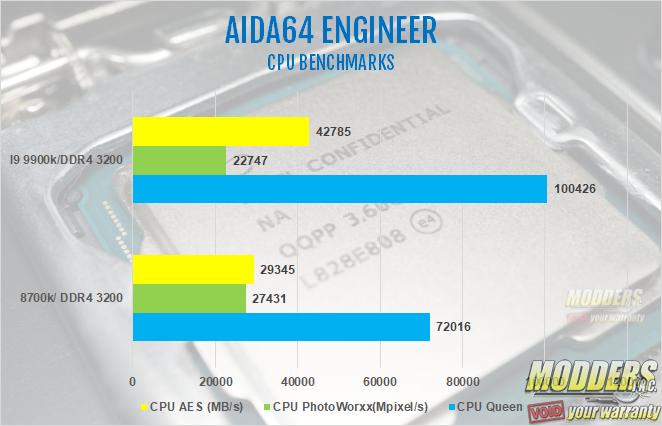
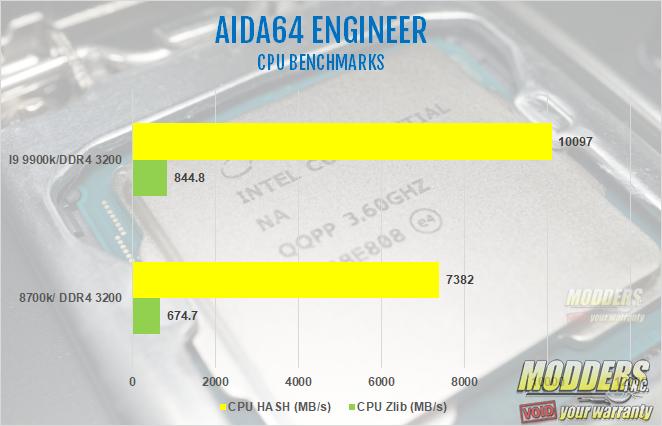
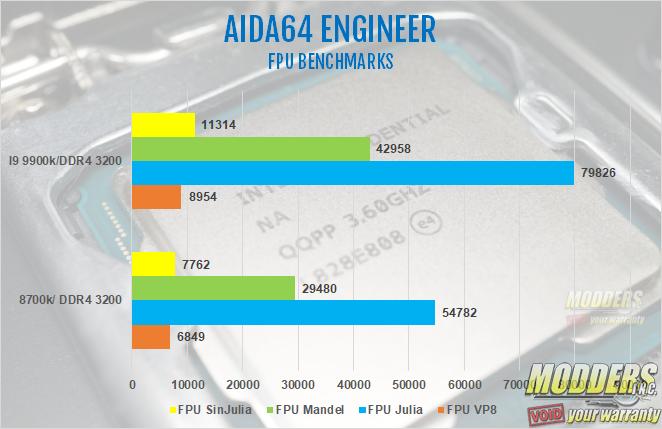
CPU Queen is an integer benchmark that tests branch prediction and misprediction penalties. CPU PhotoWorxx tests the SIMD integer arithmetic execution units of the CPU and the memory subsystem. CPU ZLib is a compression benchmark that tests the combined CPU and memory performance. CPU AES is a multi-core encryption benchmark that uses Advanced Encryption Standard data encryption. CPU Hash is an integer benchmark that measures performance using SHA1 hashing algorithm. FPU Julia measures single precision FP, FPU Mandel measures double precision FP, FPU Sin Julia measures extended precision FP while FPU VP8 is a video compression test utilizing the FPU Julia fractal module. As the chart shows the I9 9900k steadily beat out the 8700k is all tests with CPU Photoworxx being the one exception.
Cinebench R15
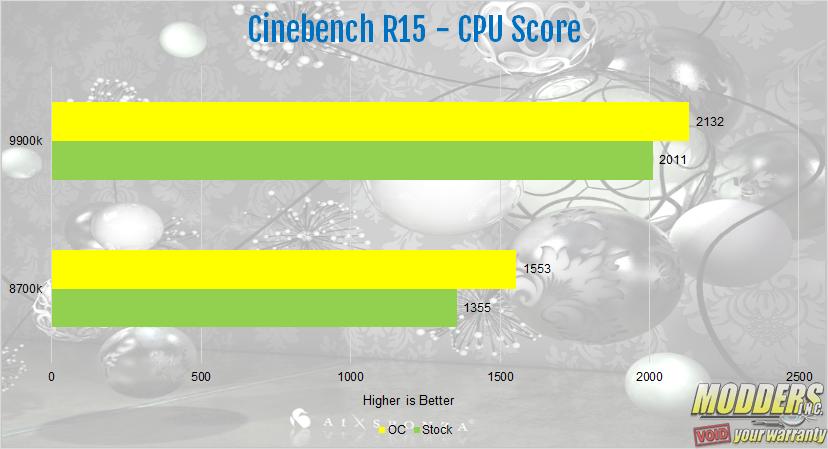
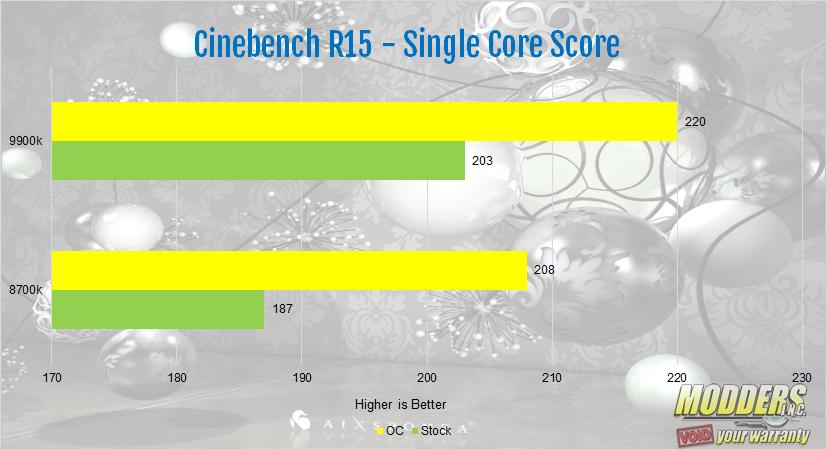
Based on MAXON’s award-winning animation software Cinema 4D, CINEBENCH is a real-world cross platform test suite that evaluates your computer’s performance capabilities. It has both the single thread and full performance test for your CPU, as well as an Open-GL test for your GPU. Cinebench R15 is one of the most widely used benchmarks used to test the performance. It puts the CPU under 100% load, but only for a very short time. Its gives a good baseline for your CPU. However, I wouldn’t use it for testing the stability of an overclock. We tested the I9 9900k at both stock and overclocked speeds. The Stock speed of the 9900k may be 3.6 GHz. However, the processor we used in this review booted between 4.7 GHz and 4.8 GHz. One quick side note is the processor used in this review was not a retail sample. It was a confidential chip sent to us by Intel for the means of a review. For the 9th generations life span, it will live on my test bench and be used in the majority of my reviews For the overclocked result, the processor was set to 5.0 GHz. The I9 9900k achieved a stock score of 2011 CB and an overclocked score of 2132. For the single core score, at stock, the 9900k hit 203 CB. I was really impressed with the overclocked score of 220. Overall, the results for Cinebench R15 were the best I’ve personally ever recorded. Even better than in our 9900k review. Just for comparison, we’ve included scores from the I7 8700k. The 8700k at stock scored 1356 CB and a single core score of 187 CB. Overclocked, it did very well with a multi-threaded score of 1555 CB and a single core score of 208 CB.
