Sub-System Benchmarks
Storage Benchmarks
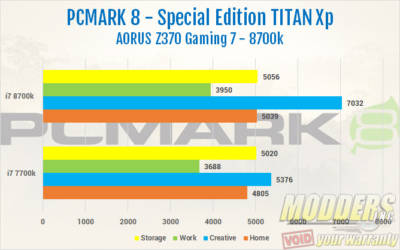
For Storage benchmarks, I used 3 different benchmarks. The first being PCMARK 8, another Futuremark program. Next, ATTO Disk Benchmark and finally, CrystalDiskMark5. ATTO and CrystalDisk Mark were used to test the 1 TB 850 Evo, a SATA drive, and a 250 GB 960 EVO, an NVME Drive. PCMARK 8 was only tested on the 850 EVO, and I also ran the conventional performance benchmarks as well.
PCMark 8
The PCMark 8 Storage benchmark is used to test the performance of SSDs, HDDs and hybrid drives with traces recorded from Adobe Creative Suite, Microsoft Office and a selection of popular games. You can test any recognized storage device, including local and external drives. Unlike synthetic storage tests, the PCMark 8 Storage benchmark highlights real-world performance differences between storage devices. We ran all three of the conventional benchmarks PCMARK 8 has to offer. These are Work, Creative and Home.
ATTO Disk Benchmark
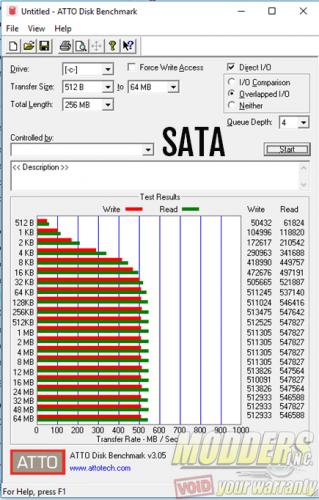
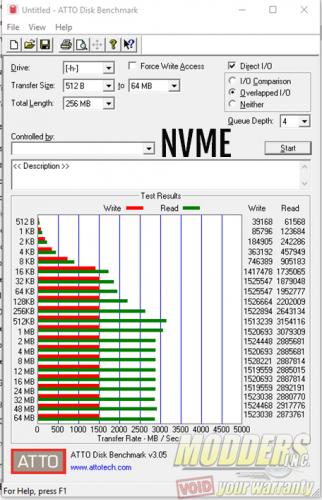
The ATTO Disk Benchmark utility was designed to measure regular disk drive performance. However, its more than capable measuring both USB flash drive and SSD speeds as well. The utility measures disk performance rates for various sizes of files and displays the results in a bar chart showing read and write speeds at each file size. The results are displayed in megabytes per second.
In ATTO, the 850 EVO M.2 did as expected, nearly saturation the SATA interface. The 850 EVO hit 547 MB/s on the read speeds and about 512 MB/s on the write speeds. On the 960 EVO, its hit 3154 MB/s and 1528 MB/s on the write.
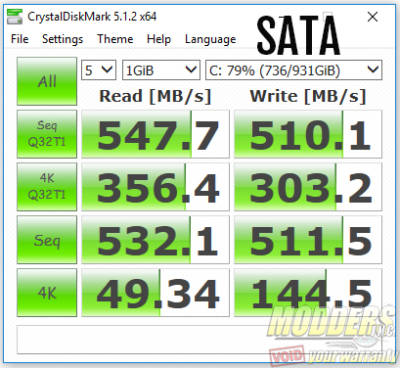
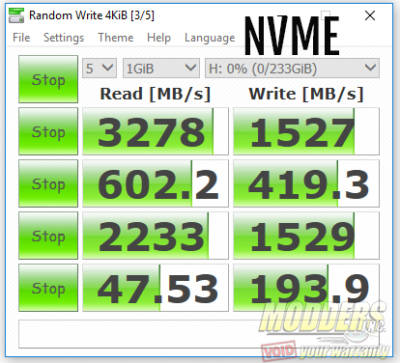
“CrystalDiskMark is designed to quickly test the performance of your hard drives. Currently, the program allows to measure sequential and random read/write speeds.” It’s one of the most commonly used utilities for testing drives.
The results for CrystalDiskMark5 were very similar to the ATTO results. The 850 EVO hit 547.7 MB/s on the read, and 510.1 MB/s on the write. Almost identical to the ATTO results. On the NVME drive, the 960 EVO hit 3279 MB/s on the read and 1527 MB/s on the write. Very close, if not a bit slower than the ATTO results.
Audio Testing
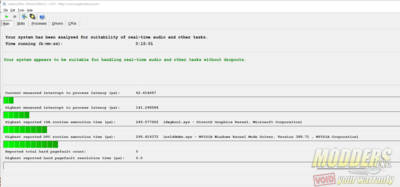
To test the on-board audio on the Z370 Gaming 7, we use the Rightmark Audio Analyzer benchmark. However, before we run the benchmark, we must test the DPC, or Deferred Procedure Call latency. The DPC is checked to ensure the audio can produce useable results in Rightmark. DPC, or Deferred Procedure Call latency, is a Windows function that handles driver efficiency and allows high-priority tasks to defer required, but lower-priority tasks for later execution. We use LatencyMon to test the DPC Latency.
I left LatencyMon run for a little over 15 minutes. The highest reported ISR routine execution time was 249.58. The highest reported DCP routine execution was 299.42. At the 4000 microseconds, the system will be unsuitable for real-time audio playback. Since both results were under this range, we can continue to Rightmark Audio Analyzer.
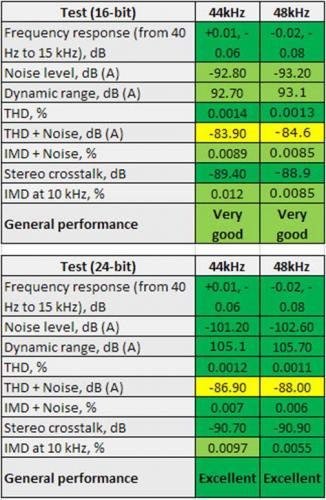
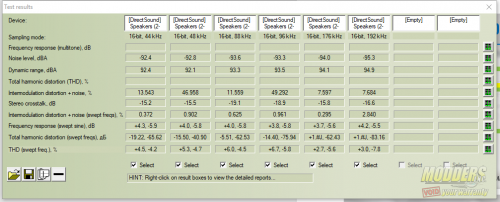
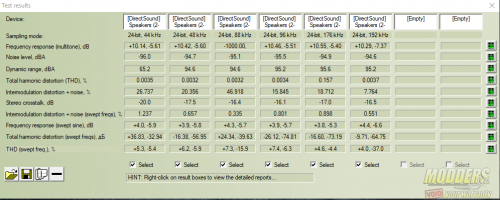
To test with Rightmark, you must first plug into both the rear headphone jack and the rear mic jack using a double-ended 3.5 mm jack cable. This creates an audio loop to test the internal audio performance of the on-board audio. We tested using both 16 and 24-bit settings through a range of frequencies from 44 kHz up to 192 kHz. The chart below is to give an idea of what good results for the Rightmark benchmark look like. When compared tot the results for the Z370 Gaming 7, the results show the Z370 Gaming 7 to have very good on-board audio.
Network Testing
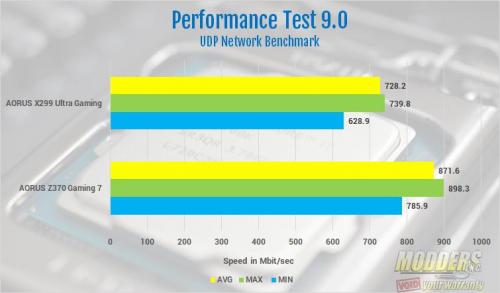
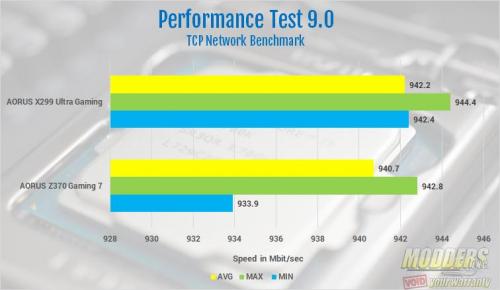
For network testing, I used my Comcast Business class router from Motorola. I used my test system as the server PC and my Lenovo W530 laptop as the server. The Laptop is from 2013, so it’s a bit old. Its running a Core I7 3820MX Extreme Edition, running at 3.6 GHz. We use the Networking Test in the PassMark Performance Test 9. We ran both the TCP and UDP Networking tests. Here are the results.



Good review Paul.
Nice looking board.