AMD Ryzen 7 3700X and AMD Ryzen 9 3900X CPU Review
Is this what we have been waiting for?
Multimedia, Compression, Synthetic, and Gaming
Handbrake
HandBrake is a free and open-source video transcoder, originally developed in 2003 by Eric Petit to make ripping a film from a DVD to a data storage device easier. Essentially, it can convert video to almost any modern format. HandBrake is available for Linux, macOS, and Windows. The workload video file is a file that I’ve used for years called Sintel. It is a 1.09-gigabyte file that is full HD. I used the Apple 240p preset for this test.
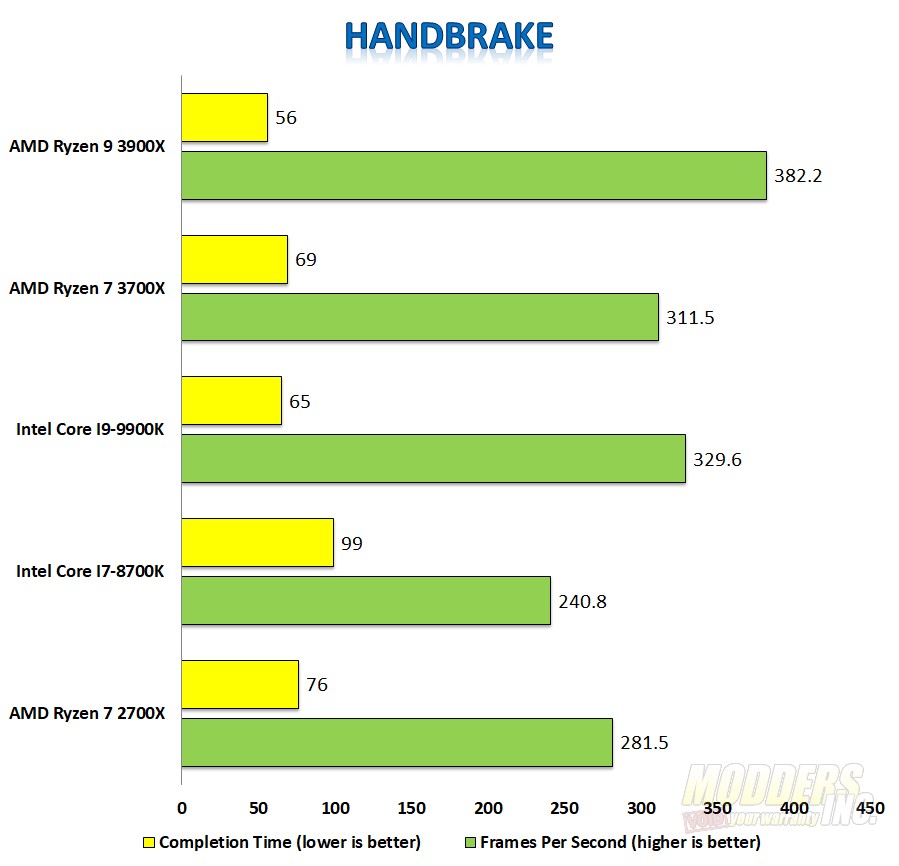 The Ryzen 9 3900x rendered the video in 56 seconds at an average frame rate of 382.2 frames per second. The Ryzen 7 3700x rendered the video in 69 seconds with an average frame rate of 311.5. From a ranking perspective and in second place, the Intel i9-9900k renders the video in 65 seconds with 329.6 frames per second average. The older Ryzen 7 2700x comes in fourth with a 76 second render time with 281.5 frames per second with i7-8700k trailing with a 99 second render time and 240.8 frames per second average. Keep in mind more cores win in this test. The 3900x has 12 cores/24 threads so it should place at the top and the 8700k has the least amount of cores and places at the bottom. Again, the interesting battle here is the Ryzen 7 3700x and the Core i9-9900k. The 3700x barely loses out to the 990ok. Four seconds and a few frames per second is all the difference between them.
7-Zip
The 7-zip benchmark shows a rating in MIPS (million instructions per second). The rating value is calculated from the measured speed, and it is normalized with the results of Intel Core 2 CPU with multi-threading option switched off. So, if you have a modern CPU from Intel or AMD, rating values in single-thread mode must be close to real CPU frequency. There are two tests, compression with LZMA method and decompression with the LZMA method. Once the total passes reach 100, the score is taken. 7-Zip gives the resulting score for decompressing, compressing, and an overall score.
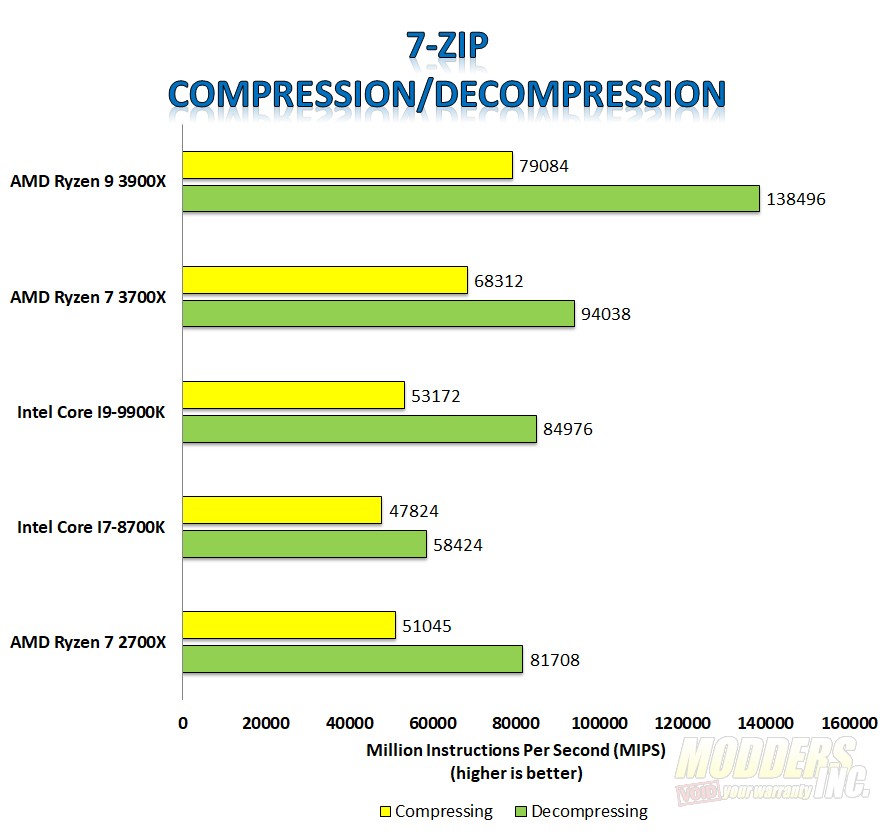 With 7-zip, it’s dang near a clean sweep. However, you can clearly see the improvements that AMD has made between the 2nd Gen Ryzen 2700x and the 3rd Gen Ryzen 3700x. There’s a bit more performance between the two and the 3700x bests both Intel CPUs. The 3900x with the increased core count really shines and totally runs away with the decompression test.
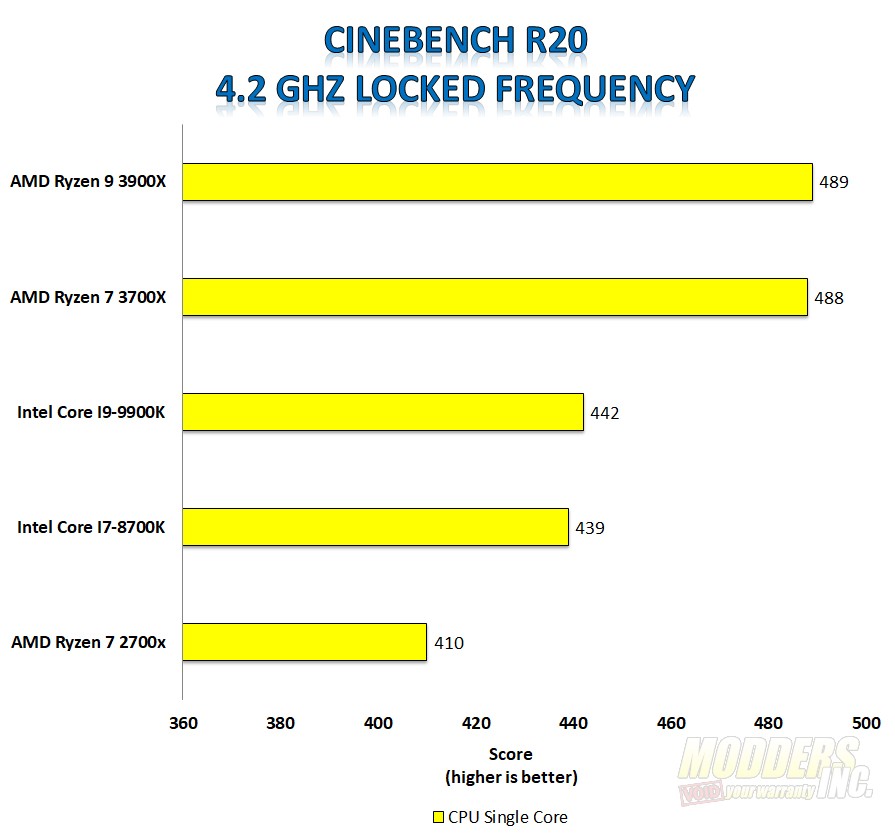
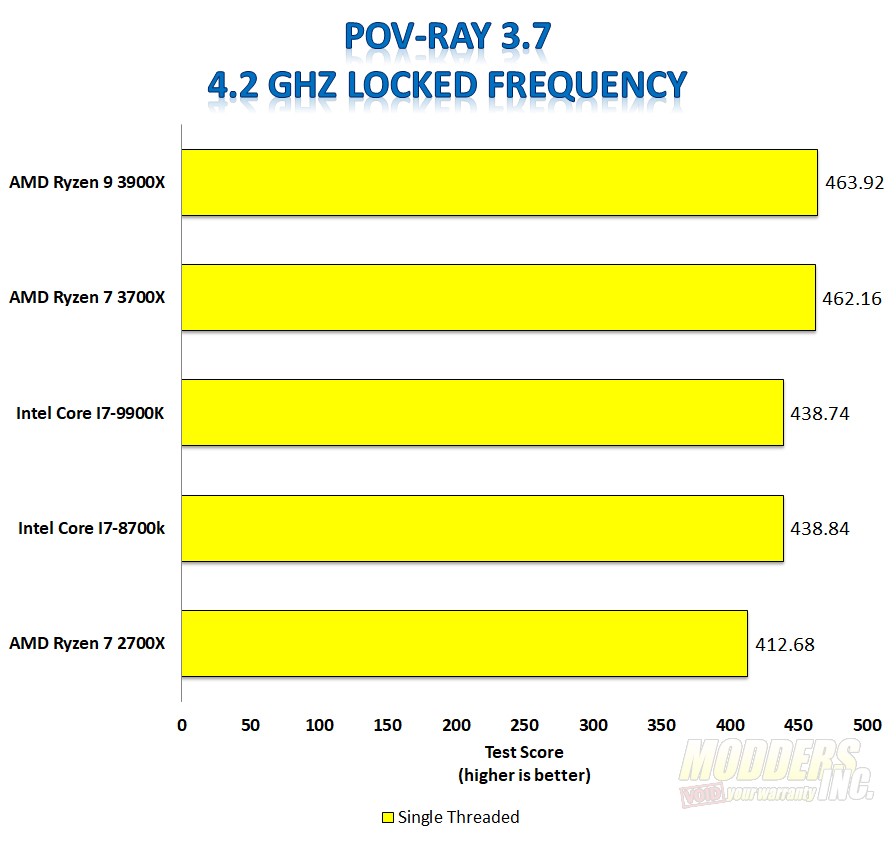
Before we move on to the final set of benchmarks, I wanted to really test clock for clock IPC performance between all of the CPUs. At this point, I disabled all boosting on the motherboards and locked the frequencies for all the CPUs at 4.2 GHz. I ran the single-core Cinebench R20 test and the Single CPU test in POV-Ray 3.7. Yes, I intentionally took away Intel’s frequency advantage in order to get a better look at CLOCK for CLOCK performance but I also negated any boosting on the AMD CPUs. Clock speeds were checked using HWMonitor to ensure no frequency advantage of any CPU.
A lot of the time, I have to cut through the marketing “speak” to get to the real information I want. AMD claimed a pretty significant IPC boost over the last generation and I wanted to see how it compared to Intel’s IPC at the same frequency. What we see is that for the first time in a long time, AMD leads Intel in IPC AT THE GIVEN CLOCK SPEED. However, while Intel’s CPUs do lag behind a bit, it’s really not that much and their frequency advantage with a high IPC still keeps AMD in check. Plain and simple, AMD cannot reach the speeds that Intel can. But bringing everything down to a level playing field for all CPUs sure helps see the improvements AMD has made.
PCMark 10 is a system benchmark for Windows PCs which focuses on common tasks performed in the office. PCMark 10 offers a variety of workloads categorized into four groups. The Essentials group includes web browsing, video conferencing, and app start-up time. The Productivity group includes tests based on spreadsheets and writing. The Digital Content Creation group includes photo editing, video editing, and a rendering and visualization test. The final group, Gaming, includes tests for real-time graphics and physics. It has three different benchmarks, PCMark 10, PCMark 10 Express and PCMARK 10 Extended.
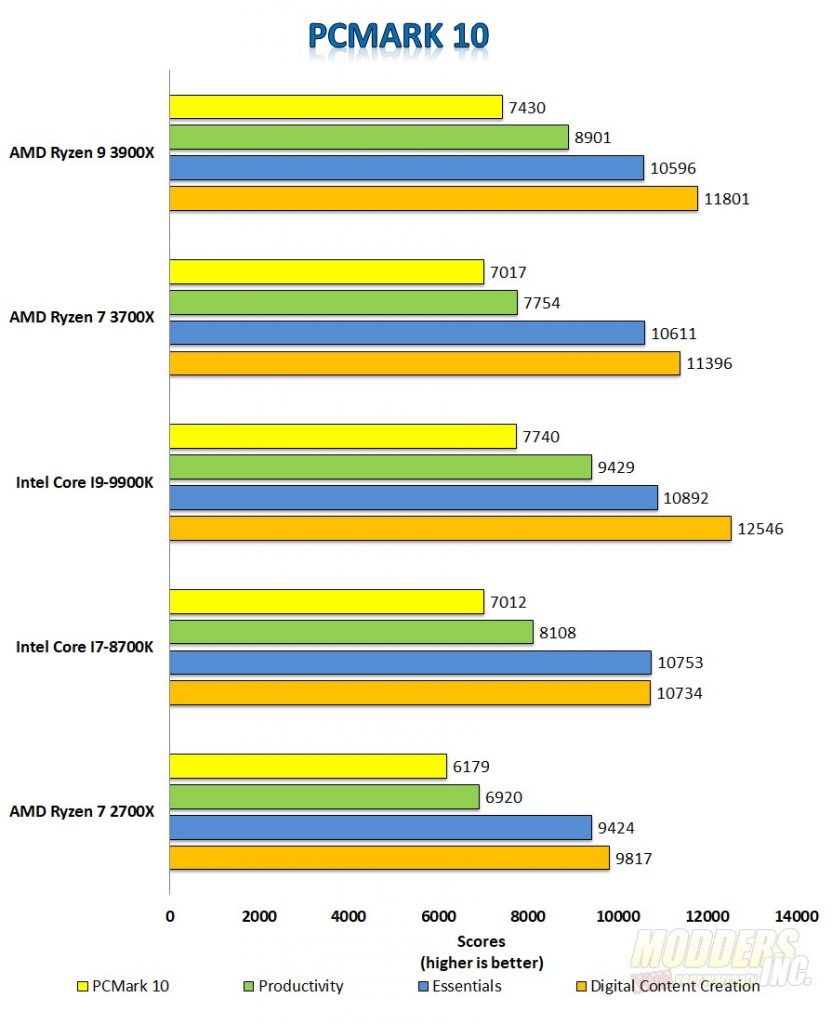
I’m not so sure we would see a better boxing match than watching AMD and Intel battle it out in PCMark 10. So overall, the Core i9-9900k takes the top spot at 7740 with the Ryzen 9 3900x nipping at its heels with a score of 7430. The Ryzen 7 3700x and the Intel Core i7-8700k are neck in neck with scores of 7017 and 7012, respectively. Where before we were seeing the Ryzen 7 3700x taking it to the Intel 9900k, we see the 3900k close behind the 9900k and the 3700x chasing the 8700k.
3DMARK
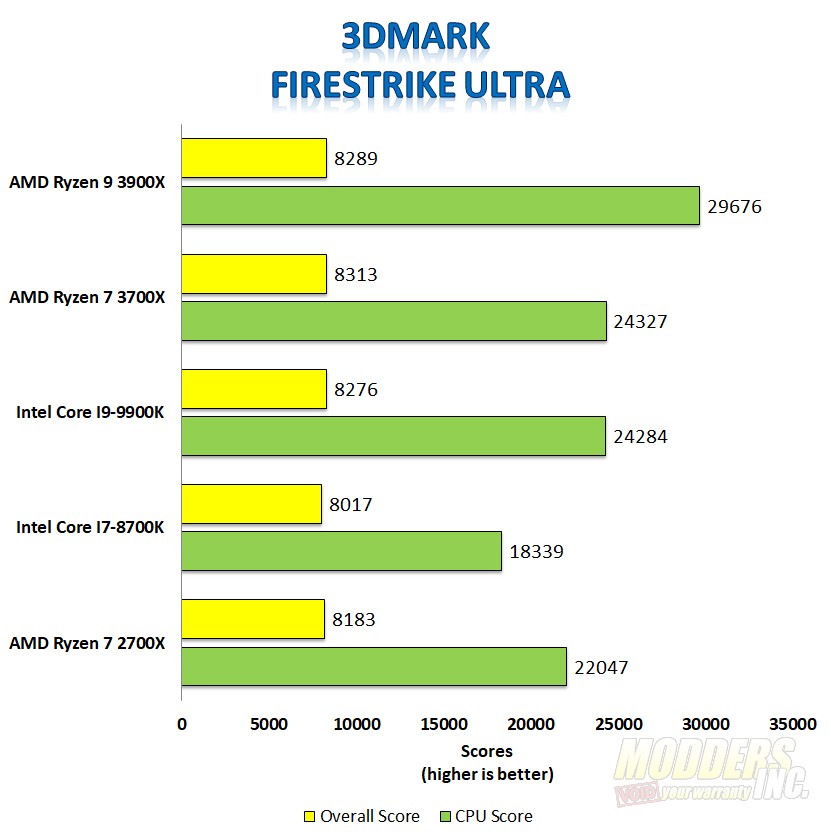
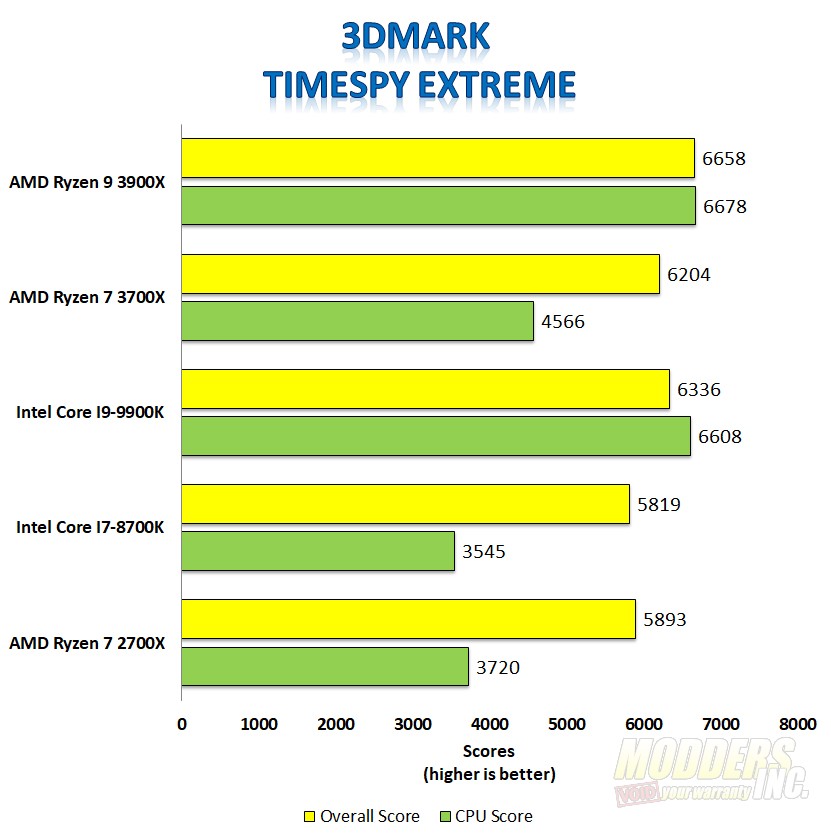
3DMark is a computer benchmarking tool created and developed by Futuremark used to determine the performance of a computer’s 3D graphic rendering and CPU workload processing capabilities. It does this through a series of graphics and physics and or CPU tests. I ran the extreme and ultimate version as I wanted to see how well AMD could handle the Nvidia GeForce RTX 2080ti.
In Firestrike Ultra, you can see the overall scores are in the same range. Really, I see no clear winner. However, the CPU scores show more cores help. Again, I go to the 3700x and the 9900k performance and compare just how close these two CPUs are in terms of performance. TimeSpy Extreme puts things back in perspective as the 3900x and 9900k duke it out for the performance crown and the 2700x and the 8700k battle each other for third place.
Gaming
For gaming, I chose to mix it up a little bit from what we’ve done in the past. Most games we test are first-person shooters, so I chose to throw a flight simulator in the mix. Xplane 11 depends heavily on single-thread performance, even more so than newer modern games. Games are slowly starting to use more and more cores. I also used the Sid Meier’s Civilization VI: Gathering Storm AI benchmark.
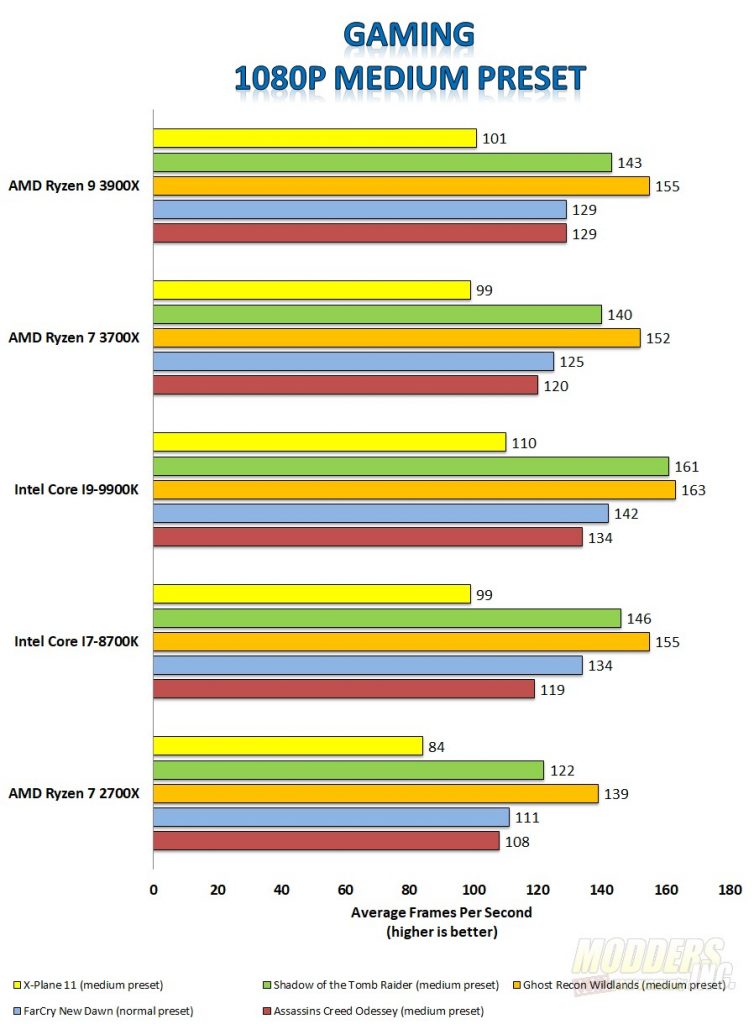
In gaming, we see the advantage Intel has over the AMD Ryzen CPUs in terms of clock speed. Most games love frequency and the more you can throw at it the better they perform. Xplane 11 is a highly detailed flight simulator that relies on single-core performance and speed. In this test, we see the Intel i9-9900k leading the pack with an average FPS if 110 with the 3900x coming in second with an average FPS of 101. For 3rd place, the 8700k and the 3700x are dead even at 99 frames per second with the 2700x trailing the pack at 84 FPS. Shadow of the Tomb Raider shows Intel leading by a good margin at 161 FPS to the 3900x’s 143 FPS. The 8700k is ever so slightly ahead of the 3700x with 146 FPS. The 2700x falls further behind at 122 FPS. Ghost Recon Wild Lands shows Intel’s 9900k leading at 163 FPS followed by the 3900x and the 8700k at 155 FPS each. Third place goes to the 3700x with 152 FPS and the 2700x is last with 139 FPS. FarCry New Dawn shows both Intel CPUs leading the AMD CPUs with the 9900k averaging 142 FPS and the 8700K with 134 compared to the 3900x with 129 and the 3700x with 125. 111 FPS is the average frame rate for the 2700x. Finally, in Assassin’s Creed Odyssey, we see the 9900k with an average frame rate of 134, the 3900x at 129, the 8700k, and 3700x are basically tied with 119 and 120, with the 2700x bringing up the rear at 108 frames per second.
The last gaming test I chose was Sid Meier’s Civilization 6 and the Gathering Storm Benchmark. This benchmarks artificial intelligence and measures the time it takes to complete each turn.
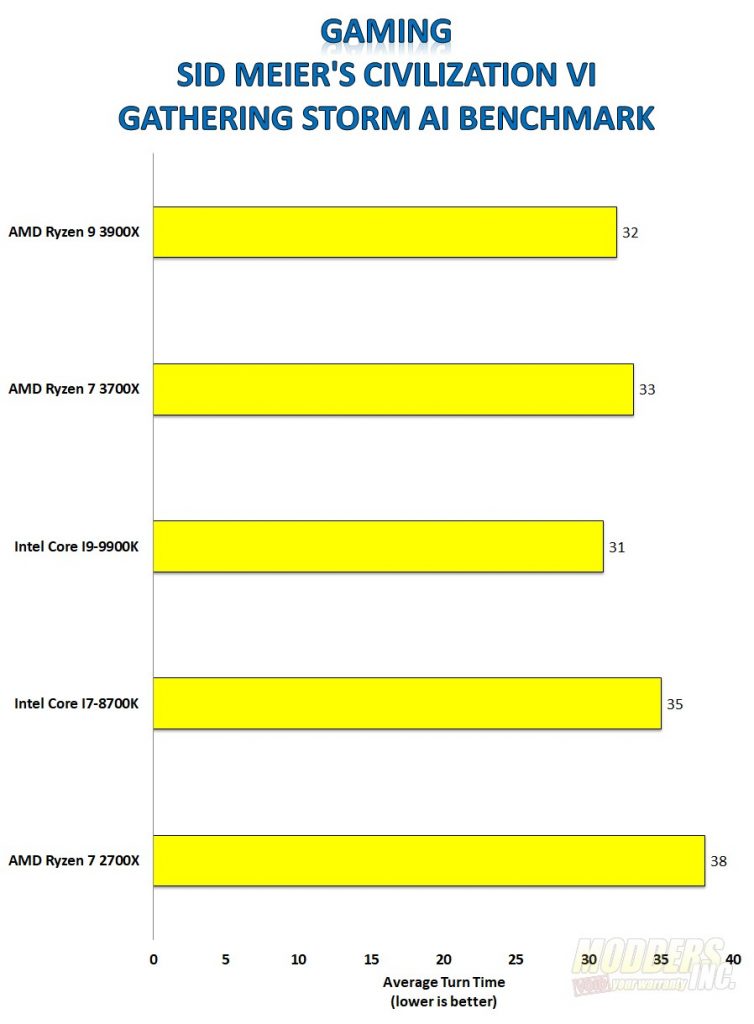
The newer CPUs are all fairly close to each other in performance with a four-second delta between first and fourth place. The 9900k turns in a time of 31 seconds. The 3900x turns in a time of 32 seconds and the 3700x turns in a time of 33 seconds. The 8700k is slightly out of the 1-second difference at 35 seconds and the 2700x completes the benchmark in 38 seconds.
