Gaming Benchmarks
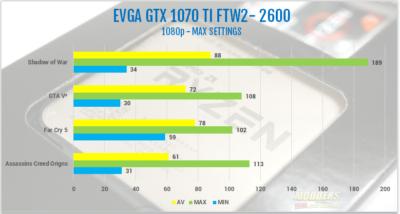
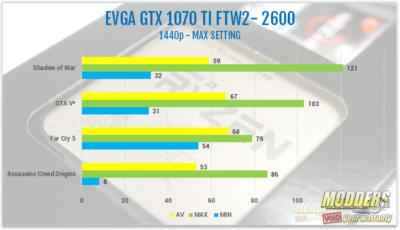
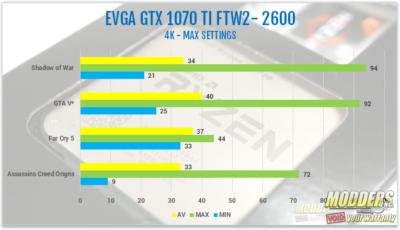
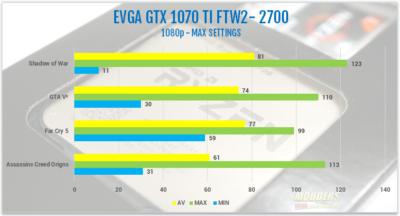
For gaming benchmarks, I chose 4 games, and mostly new titles. Games were tested with an EVGA GTX 1070 TI FTW2. I tested the new Assassins Creed Origins, Shadow of War, the sequel to Shadow of Mordor, Grand Theft Auto 5 and the newest game in my test suite, Far Cry 5. Each of the games was tested in 1080p, 1440p and 4k. For testing the integrated graphics, games were tested in 1280 x 720p on the games lowest possible settings. All games were played at their max settings. They were left at their stock settings. Each benchmark run was timed at 120 seconds, ran three times each, then averaged out to get the results.
Assassins Creed Origins is the newest game in my suite, having been releases at the end of October. The game is set in ancient Egypt. Ubisoft built a gorgeous open world that’s fun to explore. The game looks amazing. With so much detail, it’s no wonder the game puts a serious strain on your GPU. Shadow of War is the sequel to the very successful, Shadow of Mordor. Taking place in the Lord of the Rings universe, Monolith Productions did an amazing job creating the world of Middle Earth in both games. Shadow of war is beautiful, and one of the best optimized games I’ve ever played. Although GTA V is the oldest game in the suite, its still a very demanding game, especially with the Advanced Graphics on. Last was Far Cry 5, the latest in the Far Cry series. In this game, you explore the fictional Hope County in an attempt to take out a violent Cult Leader. Like other Far Cry games, Far Cry 5 is beautiful and demanding as well. However, the 1070 ti is more than capable of running the game on its ultra-preset, so that’s what we did. In fact, all games were run at their highest presets. The one exception was GTA V. For GTA V, all of the advanced graphics for GTA V were maxed out, with one exception. Frame Scaling mode was disabled do to its massive hit on the games performance, and to be honest, I don’t see a visible difference, with the exception of the performance hit. So, we keep that one setting off.
I think both processors did great with the gaming benchmarks we ran. For 1080p gaming, both the 2600 and 2700 produces almost identical results with the 1070 TI, across all four titles. THe Best performance with both chips was Shadow of War, followed by GTA V, AC Origins and last, was Far Cry 5. The biggest difference between the two processors was Shadow of War. With the 2600, Shadow of War averaged 88 FPS to 81 FPS with the 2700.
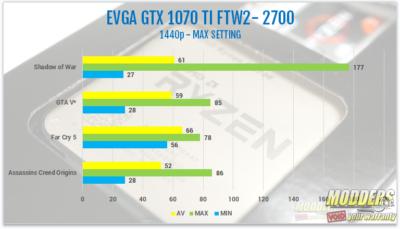
In 1440p, it was more of the same. All four games had almost identical results with each processor. The biggest difference in 1440p being GTA V. On the 2600, GTA V averaged 67 FPS. On the 2700, with the same settings, GTA V averaged only 59 FPS. Each of the other games was off my no more than 3 FPS when comparing the two processors.
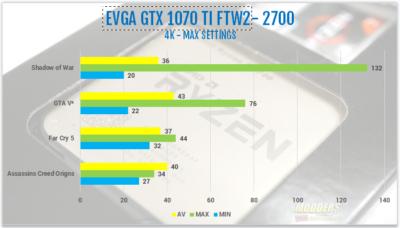
For 4k, the R7 2700 won out in all titles with the exception of Far Cry 5. Both processors averaged 37 FPS with the 1070 ti, on the games max presets. The biggest difference this time around was Assassins Creed Origins. On the R7 2700, AC Origins averaged 40 FPS. On the R5 2600, AC Origins averaged 33 FPS. Either processor you’d choose is more than capable of playing any of these games in 4k resolution, with the proper graphics card that is.
3DMARK
3DMark is a computer benchmarking tool created and developed by Futuremark used to determine the performance of a computer’s 3D graphic rendering and CPU workload processing capabilities. It does this through a series of graphics and physics and or CPU tests. I used 3DMarks most popular benchmark, Firestrike as well as their newest DX12 benchmark, Time Spy to test the EVGA GTX 1070 TI FTW2. I also used Skydiver to test the integrated graphics. The card was tested at both stock and overclocked to +175 on the core and +350 on the memory, using MSI Afterburner.
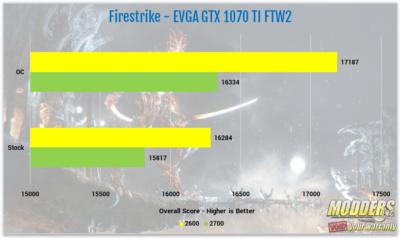
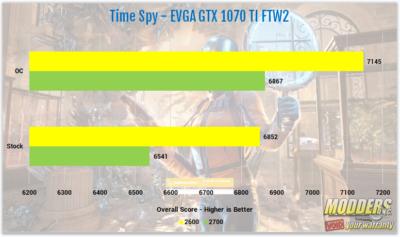
Both the R5 2600 and the R7 2700, both paired with the EVGA GTX 1070 TI FTW2, did very well in both Firestrike and Time Spy. However, to my surprise, the 2600 had higher scores than the 2700. I ran both Firestrike and Time spy several times each to make sure this wasn’t an error. Each time, the 2600 had slightly higher scores than the 2700. Both chips were tested with the 1070 TI at both its stock speed and overclocked to +175 on the core and +350 on the memory. The card did overclock slightly higher with the 2600, but I used the same overclock for both processors. On Firestrike, The R7 2700 scored 15817 on stock speeds and 16334 overclocked. The R5 2600 scored 16284 at stock, and 17187 overclocked. On Time Spy, the 2700 scores 6541 at stock, and 6867 overclocked. As for the 2600, it scored 6852 at stock and 7145 overclocked.
There are three tests for Firestrike and two for Time Spy. For Firestrike, the tests are the graphics test, physics test, and the combined test. The physics test stresses your CPU. The 2700 beat out the 2600 on the Firestrike Physics score, mainly due to its two additional cores and four threads. At the 1070 This stock speed, the 2700 achieved a physics score of 17496 and a score of 18723 while overclocked. The 2600 wasn’t too far behind with scores of 15767 at stock and 15934 with the GPU overclocked.
Time Spy is a bit different. The two tests in Time Spy are the Graphics test and the CPU test. Here, we are looking at the CPU test within Time Spy. The 2700 still won out overall, the stock scores were higher than with the GPU overclocked. The 2600 scored 5402 at stock and 5351 overclocked. Not a very big difference. However, the 2700 scored 7909 at stock and only 5835 with the GPU overclocked. This too was tested several times, with similar results each time. These results were taken from the results with the highest overall scores. Not from the highest physics and CPU scores.
Performance Test 9
Performance Test 9 is a complete system benchmark that tests every main component of your system. The area’s tested are the Disk, Memory, 2D Graphics, 3D Graphics, and CPU. There is also an overall PassMark Rating. The CPU score between the R5 2600 and the R7 2700 was close. The R5 2600 achieved a score of 12459.7 and the R7 2700 was a bit higher than the 2600 with a score of 13270.8. Both the 2D and 3D graphics were also close, but the 2600 took the lead on both scoring 889.7 on 2D and 12196.8 on 3D Graphics. This is compared to the 873.4 on the 2D Graphics and 11502.6 on the 3D Graphics. The Memory scores were very close as well, but the 2700 took the lead on this one scoring 1720.7 over the 2600s 1705.3. The Disk Mark score was 15199.5 for the 2700 and 14956.5 for the 2600. Last was the overall PassMark Rating. The 2700 scored and overall rating of 5236.5 and the 2600 scored 5196, falling just short of the 2700.
Over Clocking and Temperatures.
When the original Ryzen launched, I picked up both the 1800x and 1700x. Both were excellent chips, aside from the memory issues we all ran into. I’m happy to say I had none of the same issues with the 2600 and 2700 I had with the original Ryzen 7 line up. The few minor issues I had were resolved rather easily and were more windows issues, or operator error. To test the overclock, I ran the Aida64 stability test of about 20 minutes, maybe more but never less. There was a 30-minute break in between each test. This gives the PC enough time to cool down a bit.
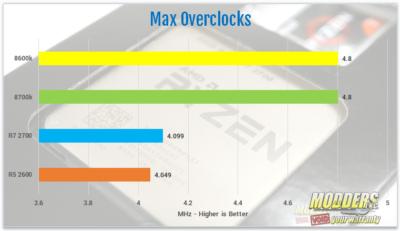
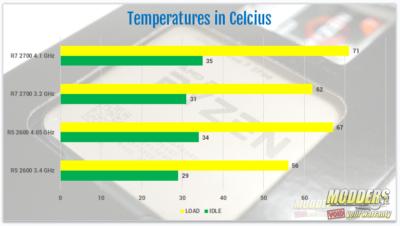
For the R5 2600, its base clock is 3.4 GHz and it will boost to 3.9 GHz. As for the R7 2700, the base is 3.2 GHz and it’ll boost to 4.1 GHz. However, when they boost, its only on one or two cores. On the 2600, I was able to get the chip to 4.05 GHz on all cores. For temperatures, the 2600 idled at 29°c at stock and hit 59°c under load. When overclocked to 4.049 GHz at 1.320 volts, the R5 2600 idles at 34°c and hit a max temp of 67°c. As for the R7 2700. Idle temps were similar. The 2700, at its stock of 3.2 GHz, idled at 31°c and hit a max temp of 62°c under load. The 2700 we tested overclocked to 4.099 volts at 1.320 volts. For temperatures, the R7 2700 idled at 35°c and hit a max temp of 71 °c under load. Overall, I was very pleased with the results. Especially since the 1700x I had never went past 3.85 GHz and the 1800x hit 4.025 on a single core, but on past 3.9 on all cores. This isn’t the increase in overclocking ability I had hoped for, but it’s an improvement none the less.
