AMD FX-9590 Processor Review: Brute Almighty
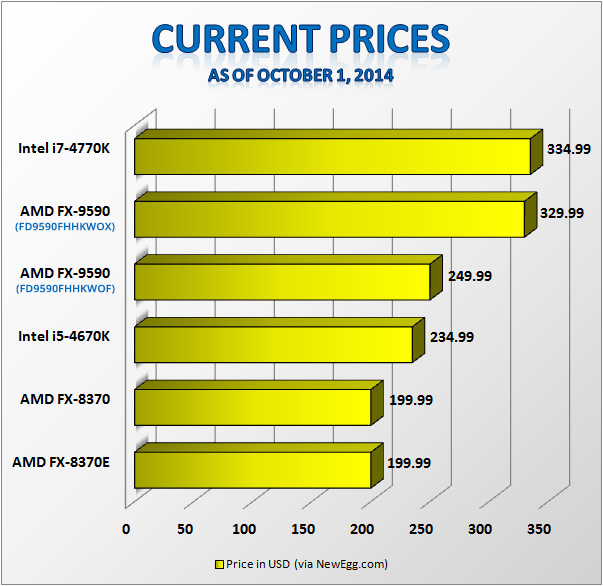
Before proceeding, let us look at the current prices for the processors in the comparison tests so that their relative performance might be placed in proper context.
The price for the FX-9590 is all over the place and some are actually retailing higher than the $229 suggested MSRP. Many stores are also sold out or out of stock which suggests, there is a demand for it. The FX-9590 with the bundled cooler is pricey at $329 from NewEgg but can be had for as low as $282 at NCIXUS which of course, I would recommend if you are looking for that model. For $329, you might as well get a larger cooling solution and buy the FX-9590 CPU barebones so that you get more bang for your buck.
System Benchmarks
wPrime 1.55
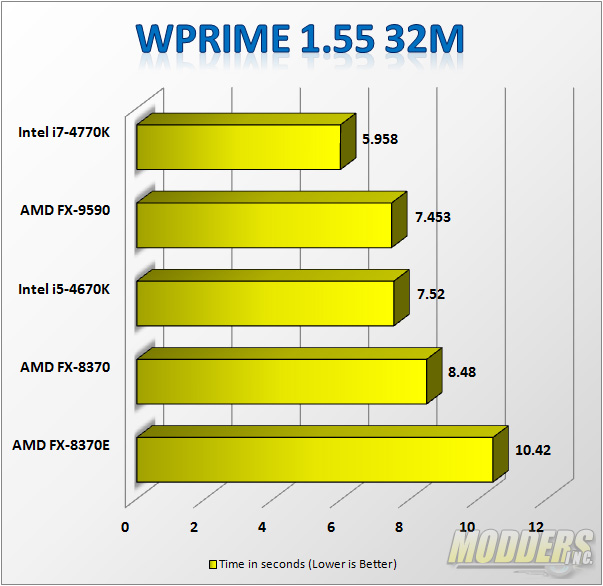
wPrime is a good quick CPU-sensitive multi-threaded math calculation benchmark that utilizes square roots instead of prime numbers. The 32 million number benchmark is used.
The i5-470K and FX-9590 are neck and neck in this benchmark while the i7-4770K runs away with its HyperThreading performance.
AIDA64 CPU
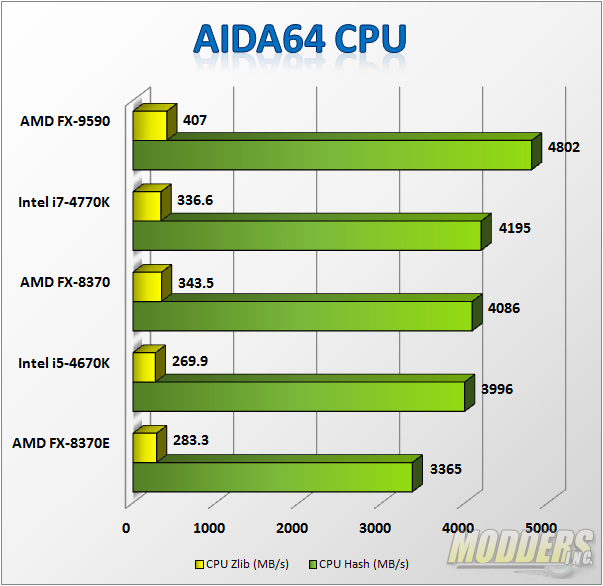
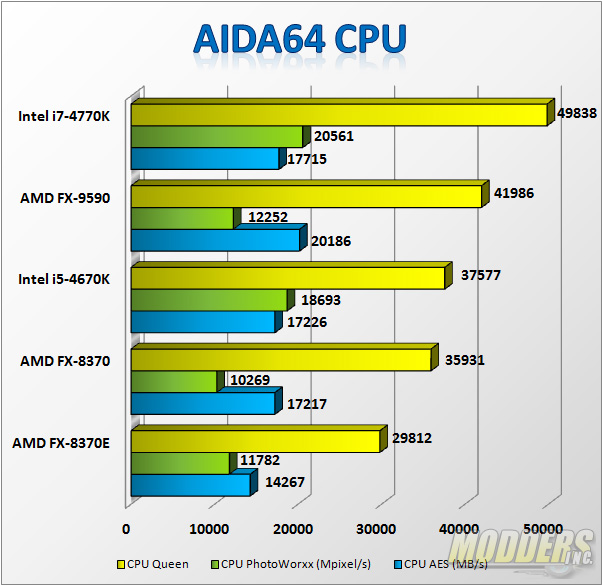
The AIDA64 suite has various benchmarks for CPU, FPU and memory testing: CPU Queen is an integer benchmark that tests branch prediction and misprediction penalties. CPU PhotoWorxx tests the SIMD integer arithmetic execution units of the CPU and the memory subsystem. CPU ZLib is a compression benchmark that tests the combined CPU and memory performance. CPU AES is a multi-core encryption benchmark that uses Advanced Encryption Standard data encryption. CPU Hash is an integer benchmark that measures performance using SHA1 hashing algorithm.
Interesting results here with the FX-9590 taking the lead over the more expensive i7-4770K on the CPU ZLIB and Hash tests indicating strong x86 compression and SHA1 hash performance. QPU Queen’s branch prediction benchmark and AES encryption tests also shows a considerable lead for the FX-9590 over the i5-4670K although the PhotoWorxx benchmark reveal the image processing shortcomings of the FX processors compared to Intel’s.
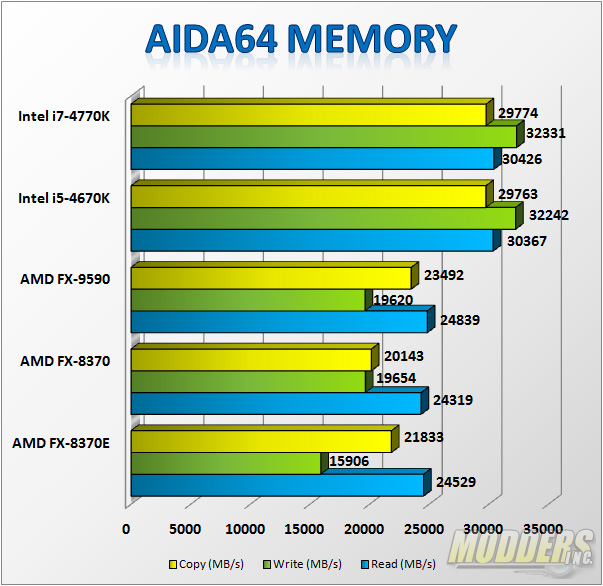
AIDA64 FPU and Memory
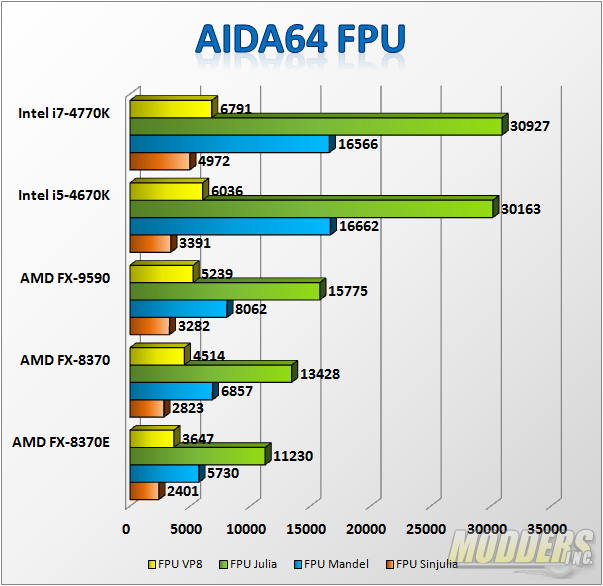
FPUJulia measures single precision FP, FPU Mandel measures double precision FP, FPUSinJulia measures extended precision FP while FPUVP8 is a video compression test utilizing the FPUJulia fractal module.
Once again, the FX series processors here show their age with the memory and FPU performance, lagging behind both Intel processors. When it came to memory performance, the higher clocked FX parts showed improved write performance but read performance improvement was small.
Cinebench R15
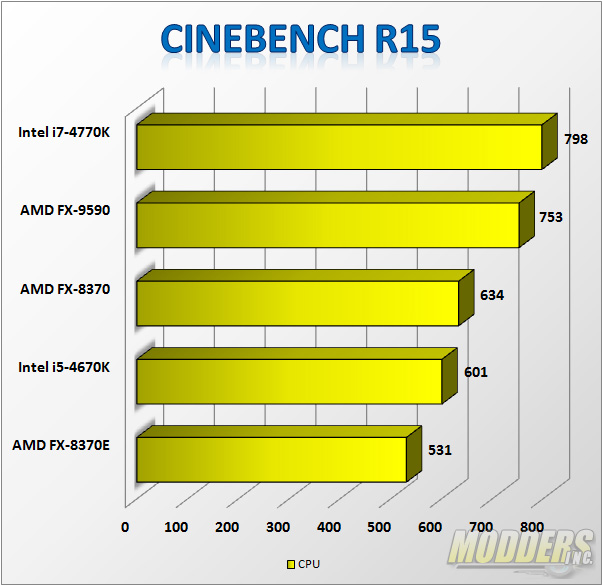
MAXON’s Cinebench R15 runs two sets of benchmarks, a processor test for the CPU and an OpenGL test for the graphics cards. The 3D rendering workload is based on Maxon’s Cinema 4D, a program utilized by movie production studios world wide for special effects so it is a semi-synthetic test closer to real-world 3D graphics benchmarking.
The latest Cinebench R15 version is much less Intel HT biased now compared to previous R11.5 version. The multi-threaded CPU benchmark show that the FX-9590 is closer to the Hyper-threaded i7-4770K with the FX-8370 also pulling slightly ahead of the i5-4670K.
Futuremark PCMark 8
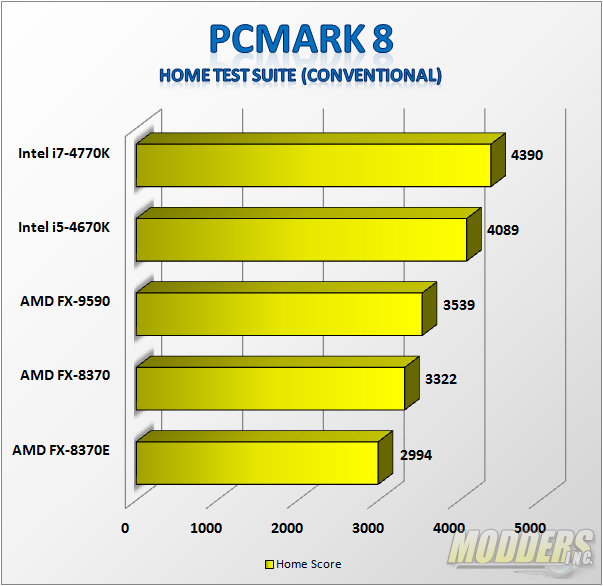
PCMark 8 simulates typical home-related workloads including web browsing, gaming, photo editing, video chat and productivity. Like Futuremark’s 3DMark, a numerical score is generated from the combination of semi-synthetic tests. AMD’s A0-7850K can take advantage of OpenCL acceleration to accelerate the performance.
PCMark 8 is a collection of tests, not just testing one specific function but overall performance and their index shows the Intel CPUs pulling ahead in a test suite that includes simulated HD web-chat, web browsing, light gaming, word processing and photo editing.
WinRAR
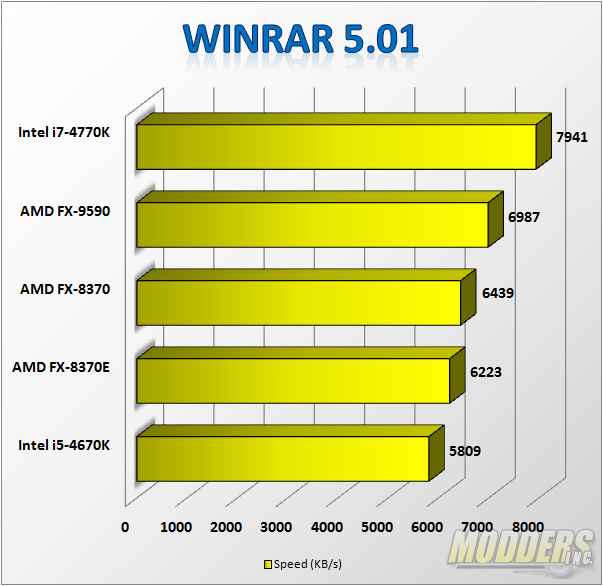
WinRAR is a very popular compression program and has a built-in multi-threaded benchmark.
WinRAR takes advantage of Intel’s Hyper Threading very well here and the i7-4770K pulls far ahead of all the other processors although the FX series strong compression performance still shows with even the FX-8370E faring better than the Intel i5-4670K.
x264 FHD 1.0.1
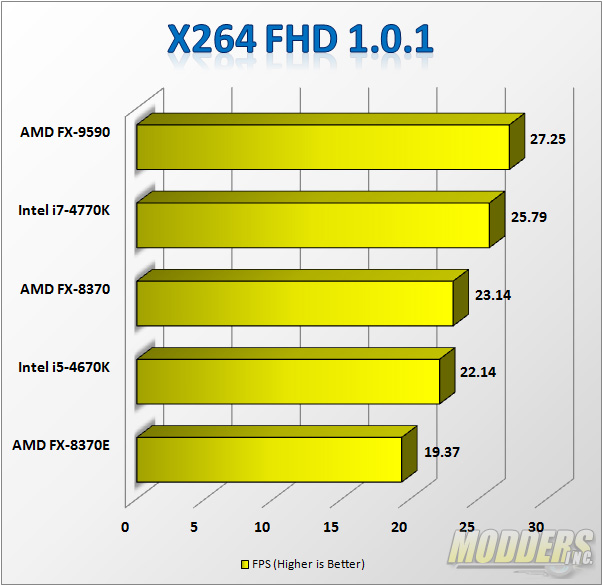
x264 is a popular free software library for encoding video streams into the H.264/MPEG-4 AVC format. x264 FHD measures how efficient a system is in encoding H.264 video and produces results in frames-per-second.
The brute force performance of the FX-9590 pulls the lead here with against even the i7-4770K while the i5-4670K had to take a backseat even against the FX-8370 to fourth place.
Handbrake 0.9.9
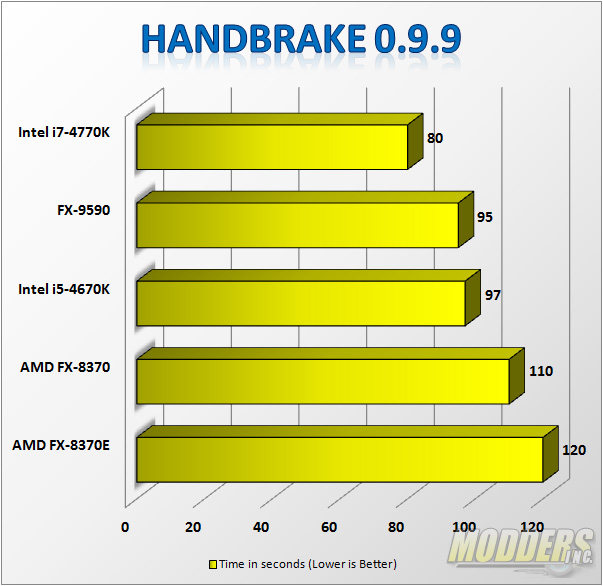
Handbrake is free open-source video transcoder that can convert various video file formats to compatible video files for other typical media viewing applications such as in an iPhone or Android tablet. A 52:55 1.1GB H.264 MKV file was used converted to the built-in iPod Preset (5G Support), then manually timed. The results are in seconds and the lower number is the better result.
Performance is very close between the FX-9590 and the i5-4670K here with AMD eventually running faster by two seconds while the i7-4770K pulls far ahead with a 15 second gap against the FX-9590.
Gaming Tests
Futuremark 3DMark Firestrike
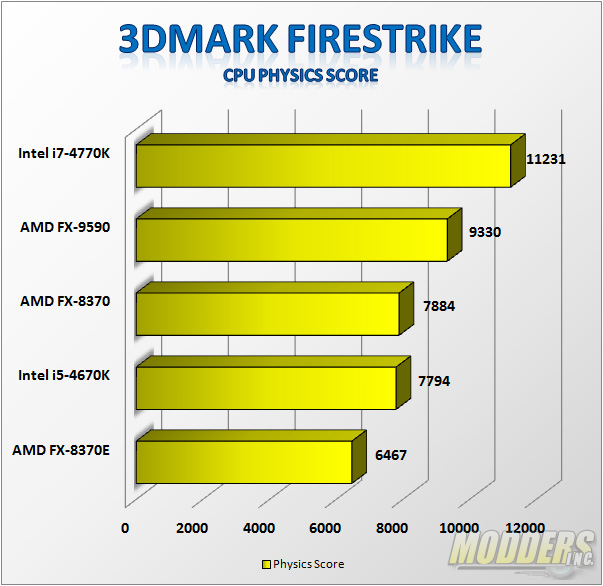
Futuremark’s 3DMark is a semi-synthetic gaming benchmark that calculates both graphics and CPU-bound physics in a controlled series of tests and provides scores that can be compared with other gaming platforms.
Compared to 3Dmark11, 3DMark Firestrike’s physics tests use the open-source Bullet Physics engine which is a lot less biased with NVIDIA based GPUs and is strictly CPU-bound, this makes it an effective assessor of CPU-only gaming physics performance despite being a semi-synthetic test. The FX-9590 pulls far ahead of the i5-4670K here which only manages to sneak behind even the FX-8370. The Hyper-Threaded i7-4770K understandably pulls far ahead in the 5-digit Physics score result.
The Elder Scrolls V: Skyrim (DirectX9)
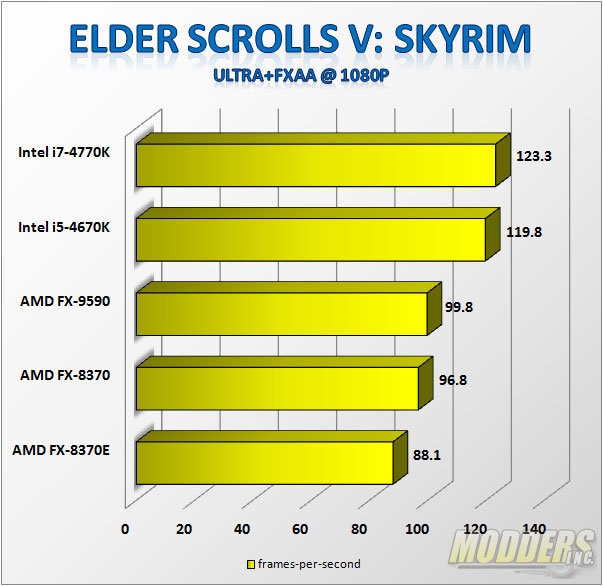
The Elder Scrolls V: Skyrim uses a DirectX9 engine that is sensitive to CPU performance and improves framerates accordingly compared to newer DirectX11 engine games which are mostly GPU dependent. Maximum settings was used with FXAA enabled and with no mods loaded. Performance was benchmarked with Fraps from a 60 second real-world gameplay.
Most decent games now use DirectX11 or newer and if their DX11+ engine is not total garbage, they will be predominantly GPU bound so the only real world gaming test we ran here was the ever-popular vanilla Elder Scrolls V: Skyrim as it is still is very sensitive to CPU performance because of its DirectX 9 engine. Results show the Intel processors pulling far ahead of the performance here at over 100+ frames per second with the FX-9590 almost making it to 3-digits at 99.8 FPS. Not that this isn’t playable but when you start adding mods and loading the game, the frame rates will drop compared to the vanilla Skyrim version.
I picked these two tests because these are the only two I have on hand that show considerable advantage of using Haswell platform over the aging 990FX platform and it still shows that the 990FX platform is still a valid gaming platform.
Is this a bottleneck of using the PCI-E 3.0 video card on the PCI-E 2.0 of the dated 990FX motherboard? NO. While I do not have the hardware and budget to test this further, there are some articles written by some of our affiliates and 3rd party publications with much larger budgets at their disposal discussing the performance gap between PCI-E 3.0 and PCI-E 2.0 (article links open in new window. SPOILER ALERT, there is not much difference AT ALL).
From TechPowerUp (May 2012-GTX 680 and HD 7970 on i7-3770K @ 1280×800 through 5760×1080): http://www.techpowerup.com/reviews/Intel/Ivy_Bridge_PCI-Express_Scaling/24.html
From HardOCP (July 2012-Single/SLI/TRI GTX 680 and Single/CFX/TRI HD 7970 on i7-2600K and i7-3770K @ 1920×1200 through 5760×1200): http://www.hardocp.com/article/2012/07/18/pci_express_20_vs_30_gpu_gaming_performance_review/1#
From Anandtech (June 2013-SLI Titan on i7-4970X @ 2560×1440 and 5760×1200): http://www.anandtech.com/show/7089/geforce-gtx-titan-twoway-sli-scaling-pcie-2-vs-pcie-3
From PugetSystems (November 2013-Single/SLI GTX Titan on i7-4770K and i7-4960X @ 1920×1080 and 3840×2160): http://www.pugetsystems.com/labs/articles/Impact-of-PCI-E-Speed-on-Gaming-Performance-518/
Even the GTX Titan in SLI on a 4K display on the PugetSystems article showed virtually no hampering performance bottleneck let alone the GTX 770 or lower video cards.
How about other tests that are notoriously CPU bound such as Arma 3?
TechSpot has benchmarked the game (September 2013) with a GTX Titan on an i7-4770K and FX-8350 and shows that there is only a 3-frame gap at DirectX11 Ultra preset between an i7-4770K overclocked to 4.5GHz and an FX-8350 overclocked to 4.5GHz (which is 2GHz slower than the FX-9590): http://www.techspot.com/review/712-arma-3-benchmarks/page5.html
Power Consumption
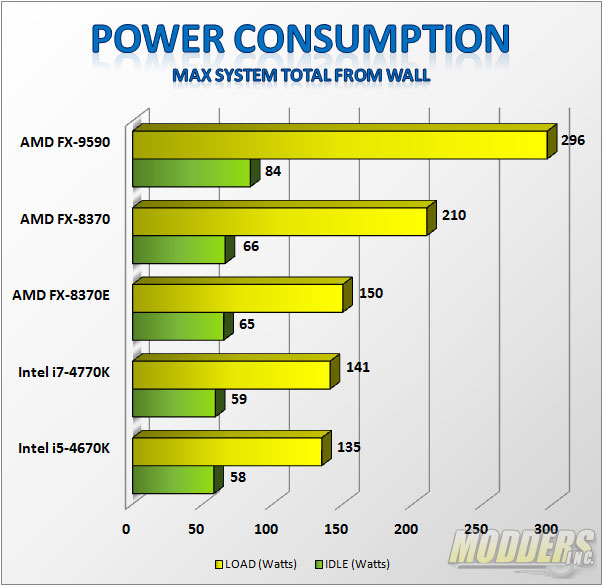
The power consumption test is performed with AIDA64 stability test for consistency with Intel Haswell CPUs. This stability test is comparable to AMD’s own built-in stability test on the Overdrive utility. I expected worse at idle but 84W is not bad considering the high clock speeds of the FX-9590. Compared to an overclocked FX-8350, the FX-9590 can run at 4.7GHz and turbo to 5GHz with all power saving options enabled so normal operations are not as bad as I thought it was from my experience with an FX-8350. The most I could pull was 340W peaked from the wall while running Intel Burn Test with AVX although it mostly hovered around 325W under IBT load.
The FX-9590 is obviously not something I can recommend for those looking for top end efficiency or live in places where the cost of electricity in kW/h is very high (Denmark, Germany, and smaller island nations). I live in Ontario, Canada so despite the recent increase, I can actually realistically run this processor without denting my wallet at 13.5c peak kW/h and off-peak of 7.5c kW.h. Still, running something like this in 2014 in your home looks ridiculous considering the efficiency displayed by recent processors including AMD’s own APUs.


Hi Ron, I too have a 9590, but it was apparently bundled with a slightly different cooler when AMD first released them last year. The fans are a different manufacturer, and I believe that they have slightly lower max airflow (somewhere in the 60cfm range IIRC). Doesnt matter anyways—at max they are WAYYYY too loud for any sane person to stand for very long.
As for you trying to keep the CPU under 60C, you should pat yourself on the back for even getting close to that. Even undervolting the 9590 at 4.7 (turbo off) 1.425V, running prime95 (max heat/power consumption/8 cores) for an hour would put me in the mid 60s. In my experience, the chip remains stable up to somewhere in the high 70s, believe it or not. And I’ve gotten the chip stable at 5ghz (no turbo), but it is right on the very edge of running too hot to be stable. Very little oc’ing headroom like you stated.
Thanks for the insight Pat. I did not know about the different fans in the first revision. I would definitely suggest something beefier for cooling such as custom loop to run this chip. The fans are just too damn loud.